When Humpty Dumpty fell from the wall, all the king's horses and all the king's men could not put Humpty together again.
Last year, the U.S. stock market suffered a similar mishap. The S&P 500 fell by almost 20% and was ‘cracked-up’ pretty badly! However, a refurbishing effort began almost immediately and has continued this year. So far, the patient has been revived and was recently returned to a Wall slightly above its highest perch last year. With some additional reconstruction effort, is it possible ‘Humpty’ can yet sit upon a much higher wall before succumbing to another tumble? That is, can all the President’s men, his policy officials, bond vigilantes, and private companies “put Humpty together again?”
Valuation Has Been Restored
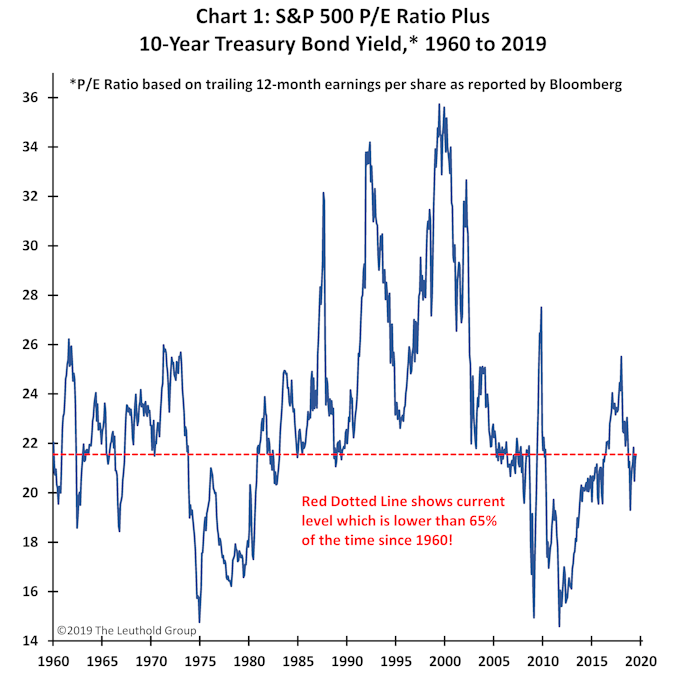
Many believe the valuation of the stock market is quite extended. Although the trailing S&P 500 price-earnings (P/E) multiple is high relative to its range between 1870 and 1990, it is currently at only the 57th percentile (just slightly above average) compared to its range during the last 30 years! Moreover, as shown in Chart 1, when consideration is given to how low competitive yield offerings are today, stocks remain cheap.
The sum of the trailing P/E multiple and the 10-year Treasury yield is currently about 21.5, which is lower than two-thirds of the time since 1950! This valuation measure regularly rose to 24 or higher during the 1960s, early 1970s, 1980s, 1990s, and the early 2000s. Indeed, the only time it was persistently lower than it is today was during the ‘runaway inflation scares’ of the 1970s and the ‘deflation scare’ early in this recovery. If earnings remain weak, the P/E multiple could still rise further because yields are so low relative to historic norms. Conversely, should yields climb, earnings will likely be growing faster again. Either way, the bull market has seemingly not yet exhausted the potential for additional ‘relative’ valuation improvement.
Importantly, valuation has been significantly restored since Humpty fell from the wall. In January 2018, the sum of the P/E multiple and the bond yield was just shy of 26, whereas today it is below 21.5—about 18% lower! Since last January, earnings have risen (albeit slowly) while bond yields have fallen. Consequently, even though the stock market is now at a new high, its relative value has been restored.
Financial Liquidity Has Been Restored
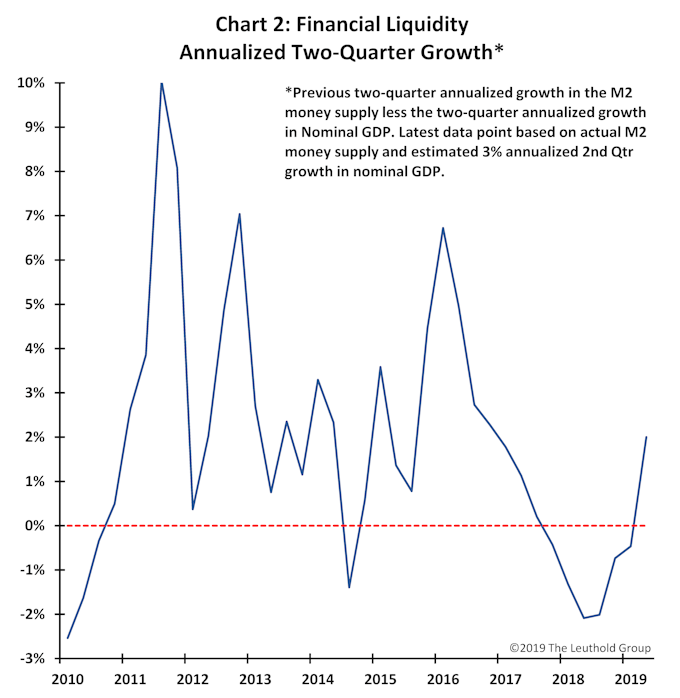
Part of the reason the stock market fell from the wall last year was because, in a rarity for this recovery, liquidity conditions turned hostile for stocks. Chart 2 illustrates financial liquidity growth, which is defined as the difference between growth in the M2 money supply relative to nominal GDP growth (i.e., excess financial market liquidity available above the portion of liquidity required to finance economic activity).
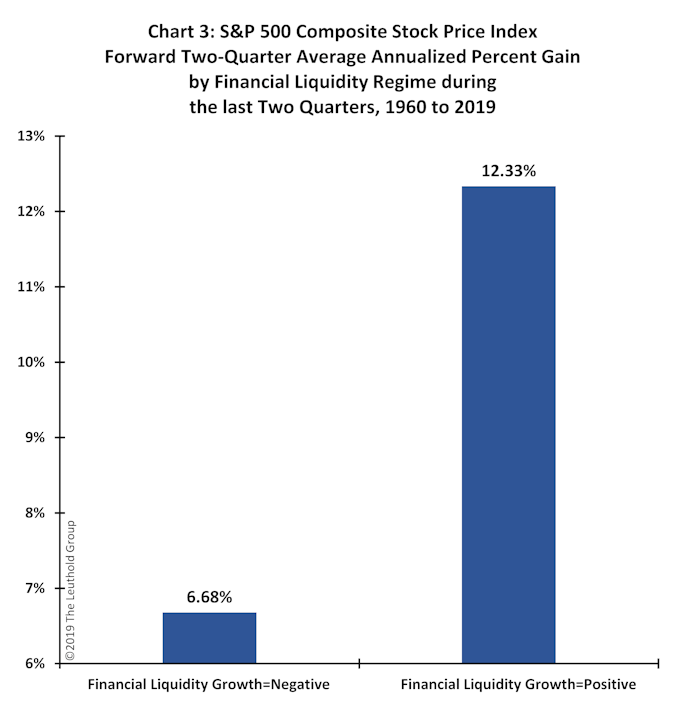
As shown, financial market liquidity began contracting in the third quarter of 2017 and did not become positive again until this year’s second quarter. The importance, for the stock market, of financial liquidity falling below the Mendoza line (i.e., turning negative) is highlighted in Chart 3. Since 1960, the stock market’s average-annualized forward two-quarter percent gain (+12.33%) has been nearly twice as great when financial market liquidity growth was positive compared to when it was contracting (+6.68%)!
If a lack of liquidity helped to ‘crack’ the stock market last year, this wound has been healed. Currently, the annualized two-quarter growth rate in financial liquidity has risen from -2% in the third quarter of 2018, to a positive 2%—its highest level since 2016.
Market Concentration Has Improved
At last year’s S&P 500 high in September, participation had thinned significantly because market leadership became concentrated among a handful of sectors. At its 2018 high, the S&P 500 had risen by about 9.6% on a year-to-date basis. However, the three best-performing sectors were up by 17.3% on average, while the bottom eight-performing sectors were up by an average of only 0.5%! In contrast, today, the S&P 500 has risen 19% since the end of last year. The top three sectors are up by 25%, on average, and the gain among the bottom eight sectors is also a healthy +15%. Compared to 2018, participation is broader and concentration is less pronounced this year, making the recent market advance more sustainable.
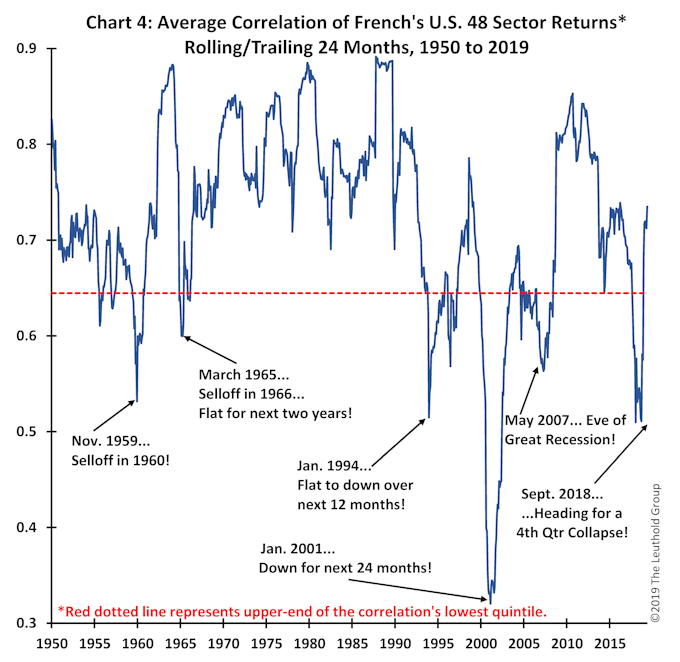
This improvement is highlighted in Chart 4, which shows the 24-month trailing correlation of monthly total returns among 48 sectors comprising the U.S. stock market since 1950. Typically, when the return correlation declines, it suggests increased market concentration and lower individual sector participation. It also implies greater return disparities among individual stocks, which may be good for active managers but is usually bad for the overall stock market. The major troughs, since 1950, in this correlation’s lowest quintile are highlighted on the chart. As can be seen, low intra-sector correlation has not been kind to future stock market returns.
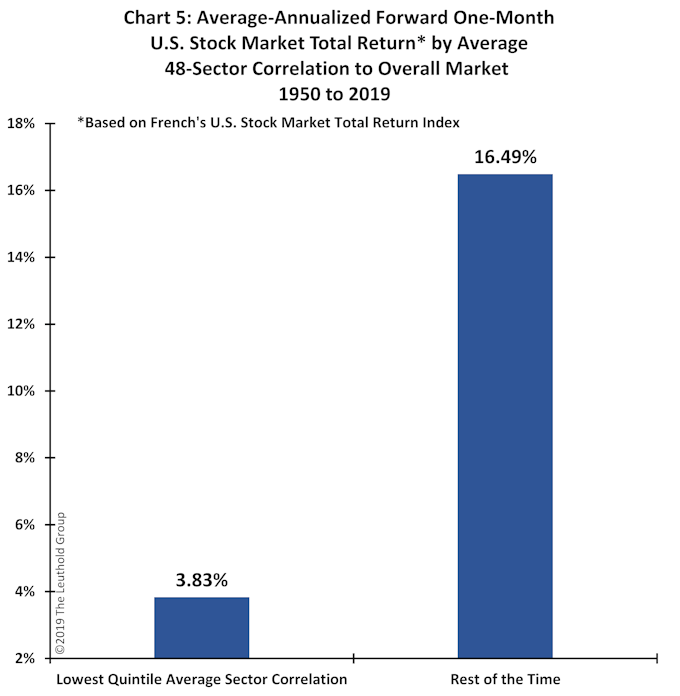
Chart 5 illustrates just how damaging lowest-quintile sector correlations (where the stock market was most of last year, bottoming in September) have been for future returns compared to the rest of the time. Since 1950, the U.S. stock market’s average-annualized forward one-month total return has been only +3.83% when sector correlation was in its lowest quintile. However, when the correlation has been in its top four quintiles, the average-annualized forward one-month total return has been a robust +16.49%!
Currently, sector correlation is at the 80th percentile, on the cusp of its highest historic quintile. Since 1950, top-quintile correlations have produced an average-annualized forward one-month total return of +20.12%. Talk about market concentration repair. Since last September, sector correlation has improved from the bottom quintile to the top quintile and now represents a solid positive for future market returns!
Investor Sentiment Has Been Retrofitted
The stock market usually does best when most are fearful, and it often does poorly when confidence is high. Since the Great Recession of 2008, despite a few moments of giddiness, investors have mostly remained cautious during this entire bull market. Perhaps the biggest breakout of optimism occurred last year. In 2017 and early 2018, for the only time in this recovery, the global economic expansion was synchronized. All economies accelerated together. Moreover, job creation was healthy, and investors were looking forward to a tax-cut-induced surge in profits! Optimism during much of last year was palatable as most looked forward to a solid year of investment returns.
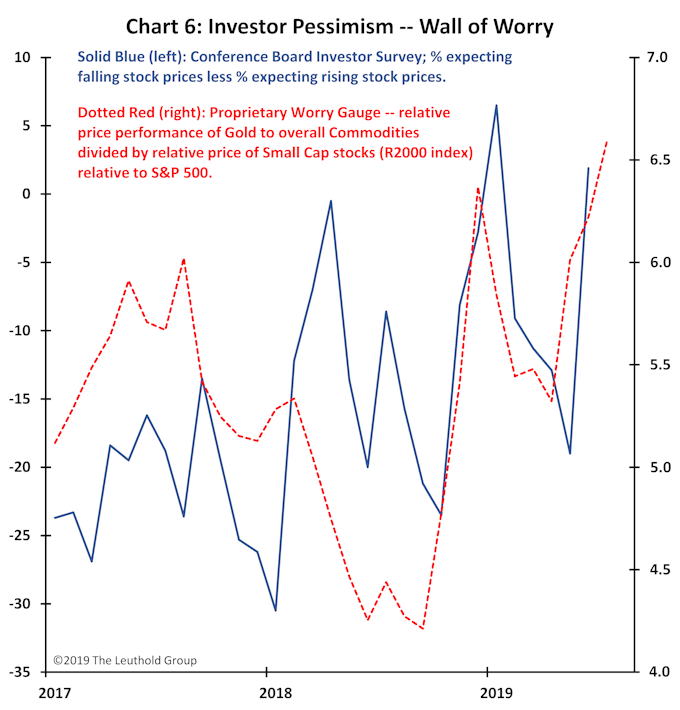
Chart 6 highlights two measures of investor pessimism. The first is based on a survey that records the percent of investors who expect falling stock prices less those who expect a rising stock market. As shown, at the start of 2018, pessimism dropped to very low levels—bulls exceeded bears by about 30%! An early-year market selloff in 2018 did increase pessimism for a few months but bullish attitudes returned again as the stock market rose to new highs in the fall (i.e., bulls outnumbered bears by almost 25% last October)! The other measure shown (the proprietary Worry Gauge) is based on investor behaviors. It rises when investors exhibit defensiveness and caution, like favoring gold over other commodities, and large cap over small cap stocks. As illustrated, this indicator of pessimism was also extremely low when the stock market peaked last September.
The collapse in the stock market late last year caused pessimism to surge, which is probably one reason the stock market ultimately bottomed in December. However, as shown, despite the stock market currently residing near all-time record highs, and despite the S&P 500 rising by almost 20% since year end, overall investor pessimism has returned to levels near where it was when the stock market bottomed on December 24th! Whatever the reasons (geo-political risk, ongoing trade war, inverted yield curve, a recovery which is now the longest-ever in U.S. history, weak earnings results, etc.), investment sentiment is no longer ‘too optimistic’ as it was most of 2018. Rather, this year it has been retrofitted toward pessimism, which is typically more supportive for a further advance in the stock market.
Can Earnings Be FIXED?
Most aspects which were troublesome for the stock market last year have been fixed! However, an important one—perhaps the most important—is still broken. Can earnings be fixed? The answer to this question may well determine how much farther this bull market has to run.
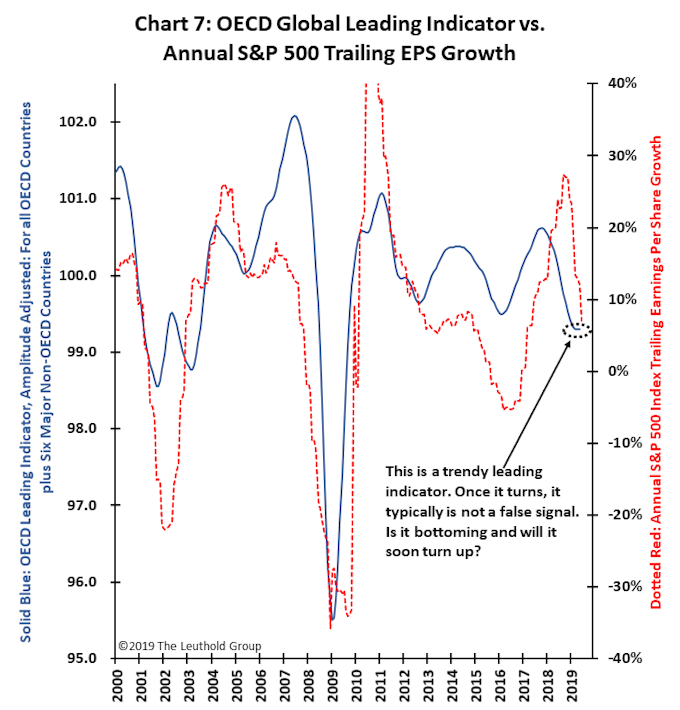
Chart 7 demonstrates that restarting the earnings cycle will again require a global-recovery spark. It overlays S&P 500 annual earnings per share growth with OECD’s global leading economic indicator. Earnings growth will only bottom when/if global economic conditions improve. In our view, improved global economic activity during the balance of this year seems likely. Indeed, the global leading indicator may already show signs of bottoming?
Policy officials about the globe have been easing dramatically since late last year and, with a lag of about six to nine months, these policies are poised to soon begin improving both economic and earnings growth. Within the U.S., annual growth in the real M2 money supply has risen from about 1% most of last year to more than 3%, the 10-year Treasury bond yield has collapsed by about 1.25% from its high last year, and the fiscal deficit as a percent of nominal GDP has expanded by 1% since the start of 2018. Policy support similar to what has been introduced in the U.S. is also evident in countries around the globe.
Possibly, these accommodative policies will fail to revive global economic activity. But betting against even a mildly positive response from a ‘full-on coordinated global policy assault’ seems like a bad bet.
Concluding Comments
All the king’s horses and all the king’s men have recently done a good job of putting Humpty back together again. Many of the challenges the stock market faced a year ago have been converted into positive forces now supporting a further advance in this bull market. The S&P 500 overall trailing P/E is only slightly above average compared to the last 30 years, and the P/E valuation adjusted for bond yields is now lower than two-thirds of the time since 1960. Financial liquidity growth turned positive in the second quarter for the first time since mid-2017. The correlation of major market sectors has risen from its lowest (worst) quintile last year, to its best quintile today.
Despite the stock market recovering to new record highs this year, by some measures current investor caution seems nearly as pronounced as it was immediately after the stock market collapsed last year. Finally, while sluggish global economic and earnings growth remains concerning, all the king’s policy officials appear to have a fix in process?
To be sure, the outlook for the stock market is not without risk. The yield curve has been inverted, the economy does exhibit some late-cycle characteristics (like a low unemployment rate), global growth remains sluggish, and the recovery is the oldest ever by calendar standards. For this reason, we would not recommend maximal ‘risk-on’ investment exposures. However, broad-based underlying support for stocks has recently been reconstructed and the likelihood of better earnings results later this year argue that investors should continue to fight their fears and remain tilted bullishly.

