A survey asking equity investors whether the stock market does best with a strong or weak U.S. dollar would likely yield a variety of contradicting opinions—and they would all be correct! Like many couples, the stock/dollar relationship is complicated. Sometimes they get along blissfully, other times they separate because they find they rarely agree and, often, they simply seem indifferent to each other. They are an odd couple!
Nonetheless, investors need to monitor whether this union is running hot or cold because it can have a significant impact on overall portfolio results. In the last decade, the relationship has been more acrimonious than at any time since the U.S. dollar came off its peg in the early 1970s. The negative correlation suggests the stock market has done best when the dollar has been the weakest, and periods of strength in the U.S. dollar have often led to a more difficult environment for stock investors. Moreover, stock market sensitivity to changes in the U.S. dollar—regardless of whether the dollar rises or declines–has been more pronounced in the last decade than at any time during the last 50 years.
Will the stock market and U.S.-dollar relationship remain estranged in the next several years and should portfolios therefore be positioned to benefit from ongoing strife in this marriage? Or, will a renewed ‘spark’ soon bring back a more harmonious courtship?
A Volatile Historic Relationship
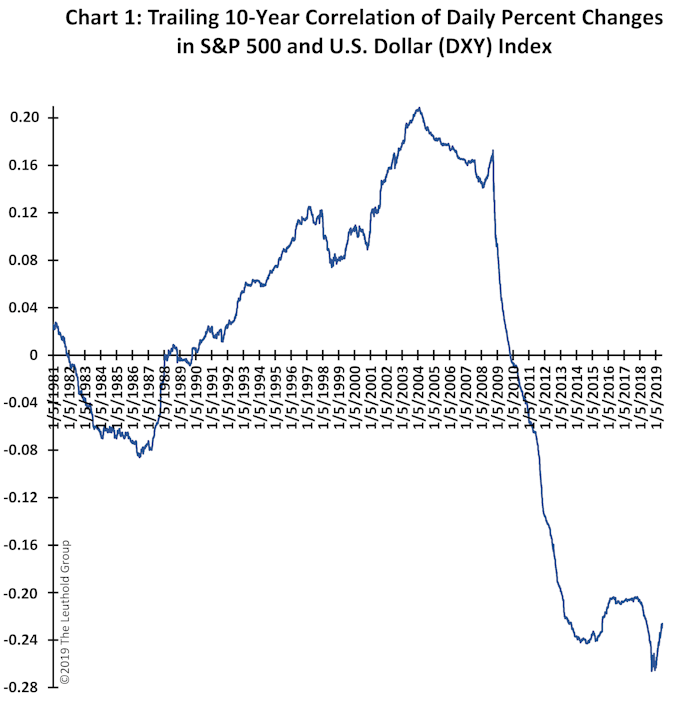
The historic relationship between stocks and the dollar is illustrated in Chart 1. It shows the trailing 10-year correlation between daily percent changes in the S&P 500 and the U.S. Trade-Weighted Dollar index. The stock market and the dollar were positively related during the 1970s, and again during the 1990s and much of the 2000s. However, as shown, the dollar and the stock market moved mostly inversely during the 1980s, and significantly opposite in the last decade. This chart highlights the volatile nature of the historical stock/dollar relationship. Sometimes a strong dollar has been good for the stock market (e.g., from 1995 to 2005 the correlation reached a record high of +0.2), sometimes the stock market does really well when the dollar is weak (e.g., from 2009 to 2019 the correlation has been a record low, near -0.26), and sometimes the two have been virtually independent (e.g., from 1980 to 1990 the correlation was zero).
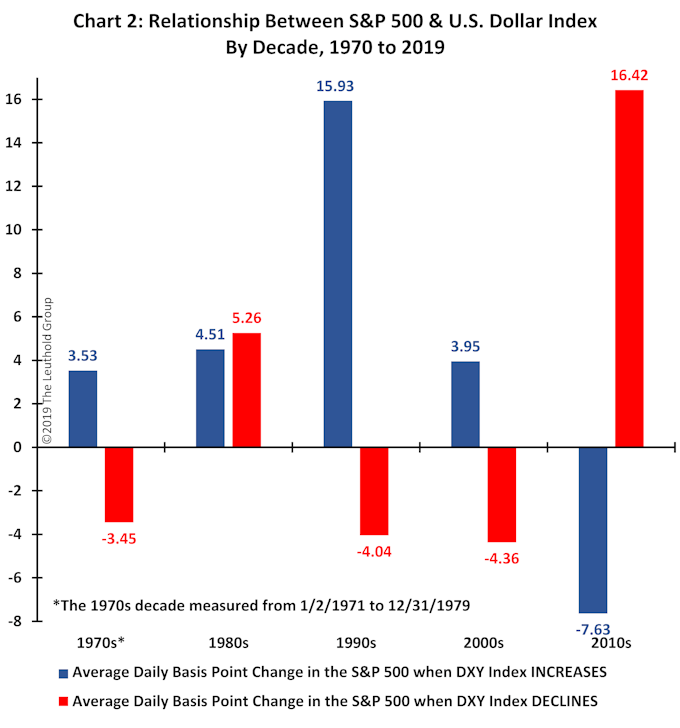
Chart 2 highlights how the stock market has reacted to changes in the dollar for each decade since the 1970s. Specifically, it shows the S&P 500 average daily basis-point change (100 basis points comprise 1%) for all trading days when the U.S. dollar index rose, and for all days when the dollar index declined. A few points are noteworthy.
First, until the last decade, a strong dollar had generally been best for the stock market. In every case during the previous four decades, the stock market’s average daily response was positive for days when the dollar rose. Similarly, in three of the last four decades (1970s, 1990s, and 2000s), a weak dollar had, on average, been bad for the stock market. Only during the 1980s did stocks rise regardless of whether the dollar increased or declined.
Second, since 2010 the relationship between the dollar and the stock market has been unique. Not only is the correlation between movements in the dollar and the stock market distinctively negative (Chart 1) but it is the only decade since 1970 when a falling dollar has been good for the stock market, while a rising dollar has been bad (Chart 2).
Third, the extent of the response from the stock market to changes in the dollar has been larger in the last decade than it has in any other decade since 1970. That is, in the contemporary recovery, not only has the stock/dollar relationship uniquely changed sign (i.e., a strong dollar is now bad, and a weak dollar is now good) but the stock/dollar ‘price beta’ is much larger compared to any other decade! On average, the S&P 500 daily basis-point change due to movements in the dollar has been much larger over the last ten years. During the 1970s, 1980s, and 2000s, the price beta ranged between -4.36 and +5.26. By comparison, in the last decade, the price beta has ranged from -7.63 to +16.42! (Even the 1990s’ wide price-beta oscillation was less than it has been during the last ten years.)
Fourth, as illustrated by the correlation in Chart 1, the magnitude of the price beta for each decade reflects the strength of the relationship between the stock market and the dollar. For example, during both the 1970s and 2000s, the stock market had a very similar price-beta profile—positive when the dollar rose and negative when the dollar fell (Chart 2). This probably reflects a mildly positive correlation for both decades. That is, from Chart 1, the correlation was slightly above zero for the decades ending in 1981 and 2000. By contrast, during the 1980s the correlation was essentially zero (i.e., the ten-year correlation measured through 1989) and its price-beta profile showed the stock market had very little reaction regardless of whether the dollar rose or fell (the price betas were nearly identical at +4.51 and +5.26, Chart 2). When the correlation is zero, the dollar simply is not that important for the stock market. However, during the 1990s, the correlation was very positive, and the price betas were outsized (they ranged from -4.04 to +15.93). Likewise, in the last ten years, the price betas have again been extremely outsized (and of different sign), as the correlation has been very negative. Overall, the magnitude of the relationship between the stock market and the dollar (i.e., how far the correlation is from zero) reflects the importance of the dollar for equity investors.
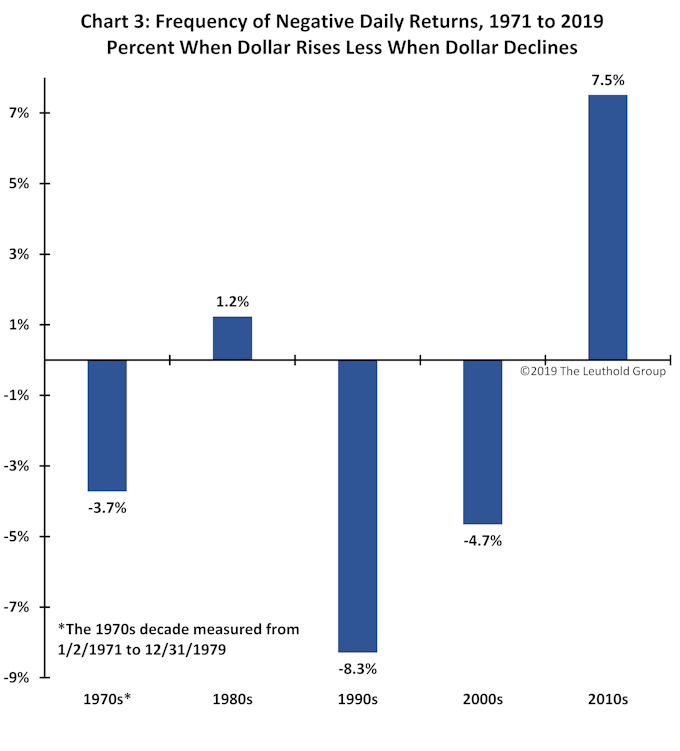
Finally, as shown in Chart 3, the likelihood of negative stock market returns varies considerably depending on the stock/dollar relationship. During the last ten years, the stock market experienced a negative daily return 7.5% more frequently when the dollar rose compared to when the dollar declined. By contrast, in the 1990s, the stock market had negative daily returns 8.3% less frequently when the dollar rose compared to when the dollar declined.
What Drives The Stock/Dollar Relationship?
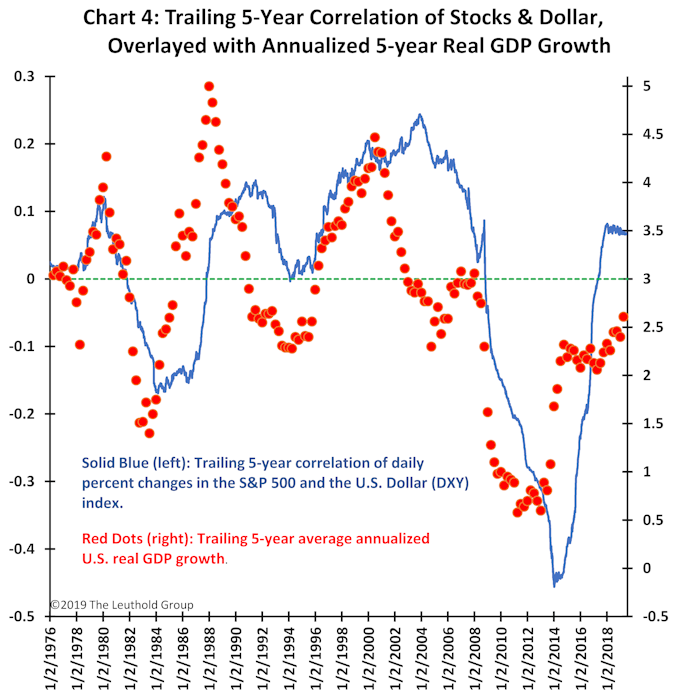
There are probably multiple factors that impact the stock/dollar relationship, but Chart 4 suggests the stock market and the U.S. dollar are linked by the pace of overall economic growth. The trailing 5-year correlation between the U.S. dollar and the stock market is compared with the trailing 5-year average annualized real GDP growth rate. Historically, the stock/dollar correlation is strongest when real economic growth is strongest. Conversely, the correlation weakens or turns negative when overall U.S. real economic growth slows.
Solid economic growth during both the 1970s’ and 1990s’ economic recoveries was associated with a strong positive relationship between the dollar and the stock market. However, as economic growth slowed after 2000, the stock/dollar correlation began to diminish and actually turned negative in the destructive aftermath of the 2008 crisis. In the last five years, however, economic growth has improved to its fastest pace since the last recovery and the correlation has again recently turned mildly positive.
Our guess is the relationship between the U.S. dollar and the stock market is related to the pace of economic growth because this establishes how concerned investors are about inflation. During periods of strong economic growth, corporate earnings are usually healthy and investor concerns often turn toward overheat risk. Consequently, when economic growth is solid, equity investors prefer a strong and rising U.S. dollar to ensure inflation and interest rate risks are kept moderate. Conversely, when economic growth is weak, stock investors are most concerned about sluggish earnings performance and welcome a weak U.S. dollar, both because it helps stimulate U.S. growth and because it improves the competitive position of U.S. companies.
In this fashion, the pace of economic growth has determined whether the U.S. dollar is friend or foe for the U.S. stock market.
Will 3% Real GDP Growth Keep This Odd Couple Happy?
The green dotted line in Chart 4 implies that an economic growth rate of about 3% may be the dividing line between a positive or negative stock/dollar relationship. Historically, real GDP growth above 3% has usually been associated with a positive correlation, and growth below 3% has often led to a negative correlation.
Can the U.S. economy consistently deliver growth above this 3% threshold in future recoveries and keep this odd couple happy? Certainly, during the balance of the contemporary recovery, given that the U.S. is already at full employment, sustaining a 3% real GDP growth rate seems unlikely. Moreover, both within the U.S. and around the globe, aging demographics, compromised balance sheets, and monetary and fiscal policies, which have been overused and are spent, may also keep solid economic growth challenging in future expansions.
Consequently, equity investors should be prepared for further discord among this odd couple. Expect a strong U.S. dollar to be a foe more often than the conventional friend it has been during the majority of the last 50 years!


