
The potential for the stock market to rise depends on how much capacity there is for improvement. Can its valuation rise? Could investor confidence improve? Do corporate profits still have room to run? Will stocks become more competitive relative to alternative investments? How spent is the economic recovery?
Typically, it is not any single challenge which ends a bull market. It’s not simply when the market becomes overvalued or when yields rise by a certain amount. Rather, a concurrence of problems often ultimately sinks a stock market. Essentially, when the stock market reaches “full capacity”—the point when there is little left to improve upon.
Capacity utilization is a concept long used when judging an economic cycle. Concepts like the factory utilization rate, the labor unemployment rate, and the economy’s output gap help in assessing the age of an economic recovery. In a similar fashion, this note calculates and examines a capacity utilization rate for the U.S. stock market. While no single indicator is ever definitive, based on its utilization rate the contemporary bull market is no spring chicken.
A Proxy For The Stock Market Utilization Rate
Although there is no conventional measure of a stock market utilization rate, we use five major factors to capture the multi-dimensional character of stock market capacity. First is the valuation level of the stock market defined as the trailing 12-month price-earnings (PE) multiple. While high valuations do not necessarily end a bull market they do diminish its potential, because once PE multiples reach historic limits, the stock market can only rise at the pace of earnings growth.
Second, the 10-year Treasury bond yield represents both a measure of competitive asset-class return and also a policy variable which impacts economic activity. The higher the bond yield, the greater the capacity of the stock market. Why? Because bond yields have farther to decline. When bond yields are high, stock valuations, economic growth, and corporate earnings performance have greater potential to improve should bond yields decline.
Third, is a measure of future earnings potential provided by the corporate profit margin. Profit is the combination of sales and profit margins. However, once margins near historic highs, future earnings growth, at best, can only approximate sales performance and may do worse if margins erode.
Fourth, is the labor unemployment rate. When the economy is at less than full employment, economic growth can strengthen without causing negative consequences for the stock market. When there is ample slack, economic growth simply absorbs unemployed resources without aggravating cost-push pressures, inflation, or the need to raise interest rates. This type of economic growth is often associated with solid earnings performance, rising PE valuations, and policy officials who can remain accommodative or supportive of the stock market. Once full employment is reached, however, economic growth begins to have negative implications for the stock market. Cost pressures emerge, bond yields rise, PE multiples contract, and economic policies are forced toward tightening.
Finally, the level of private-player confidence is important. How much room is left for improvement in investor sentiment? Are most investors already fully invested in stocks and giddy with optimism, or are fearful attitudes evidenced by considerable cash balances? Have companies’ conservative attitudes left them with considerable liquidity and ample borrowing capacity or have past expansion efforts left them with excess capacity?
While other factors are also arguably important when assessing stock market potential, these five provide a reasonable characterization of the possibilities for an advance in stock prices. Ultimately, they capture the major aspects underlying the stock market which could yet improve.
Components Of Stock Market Utilization
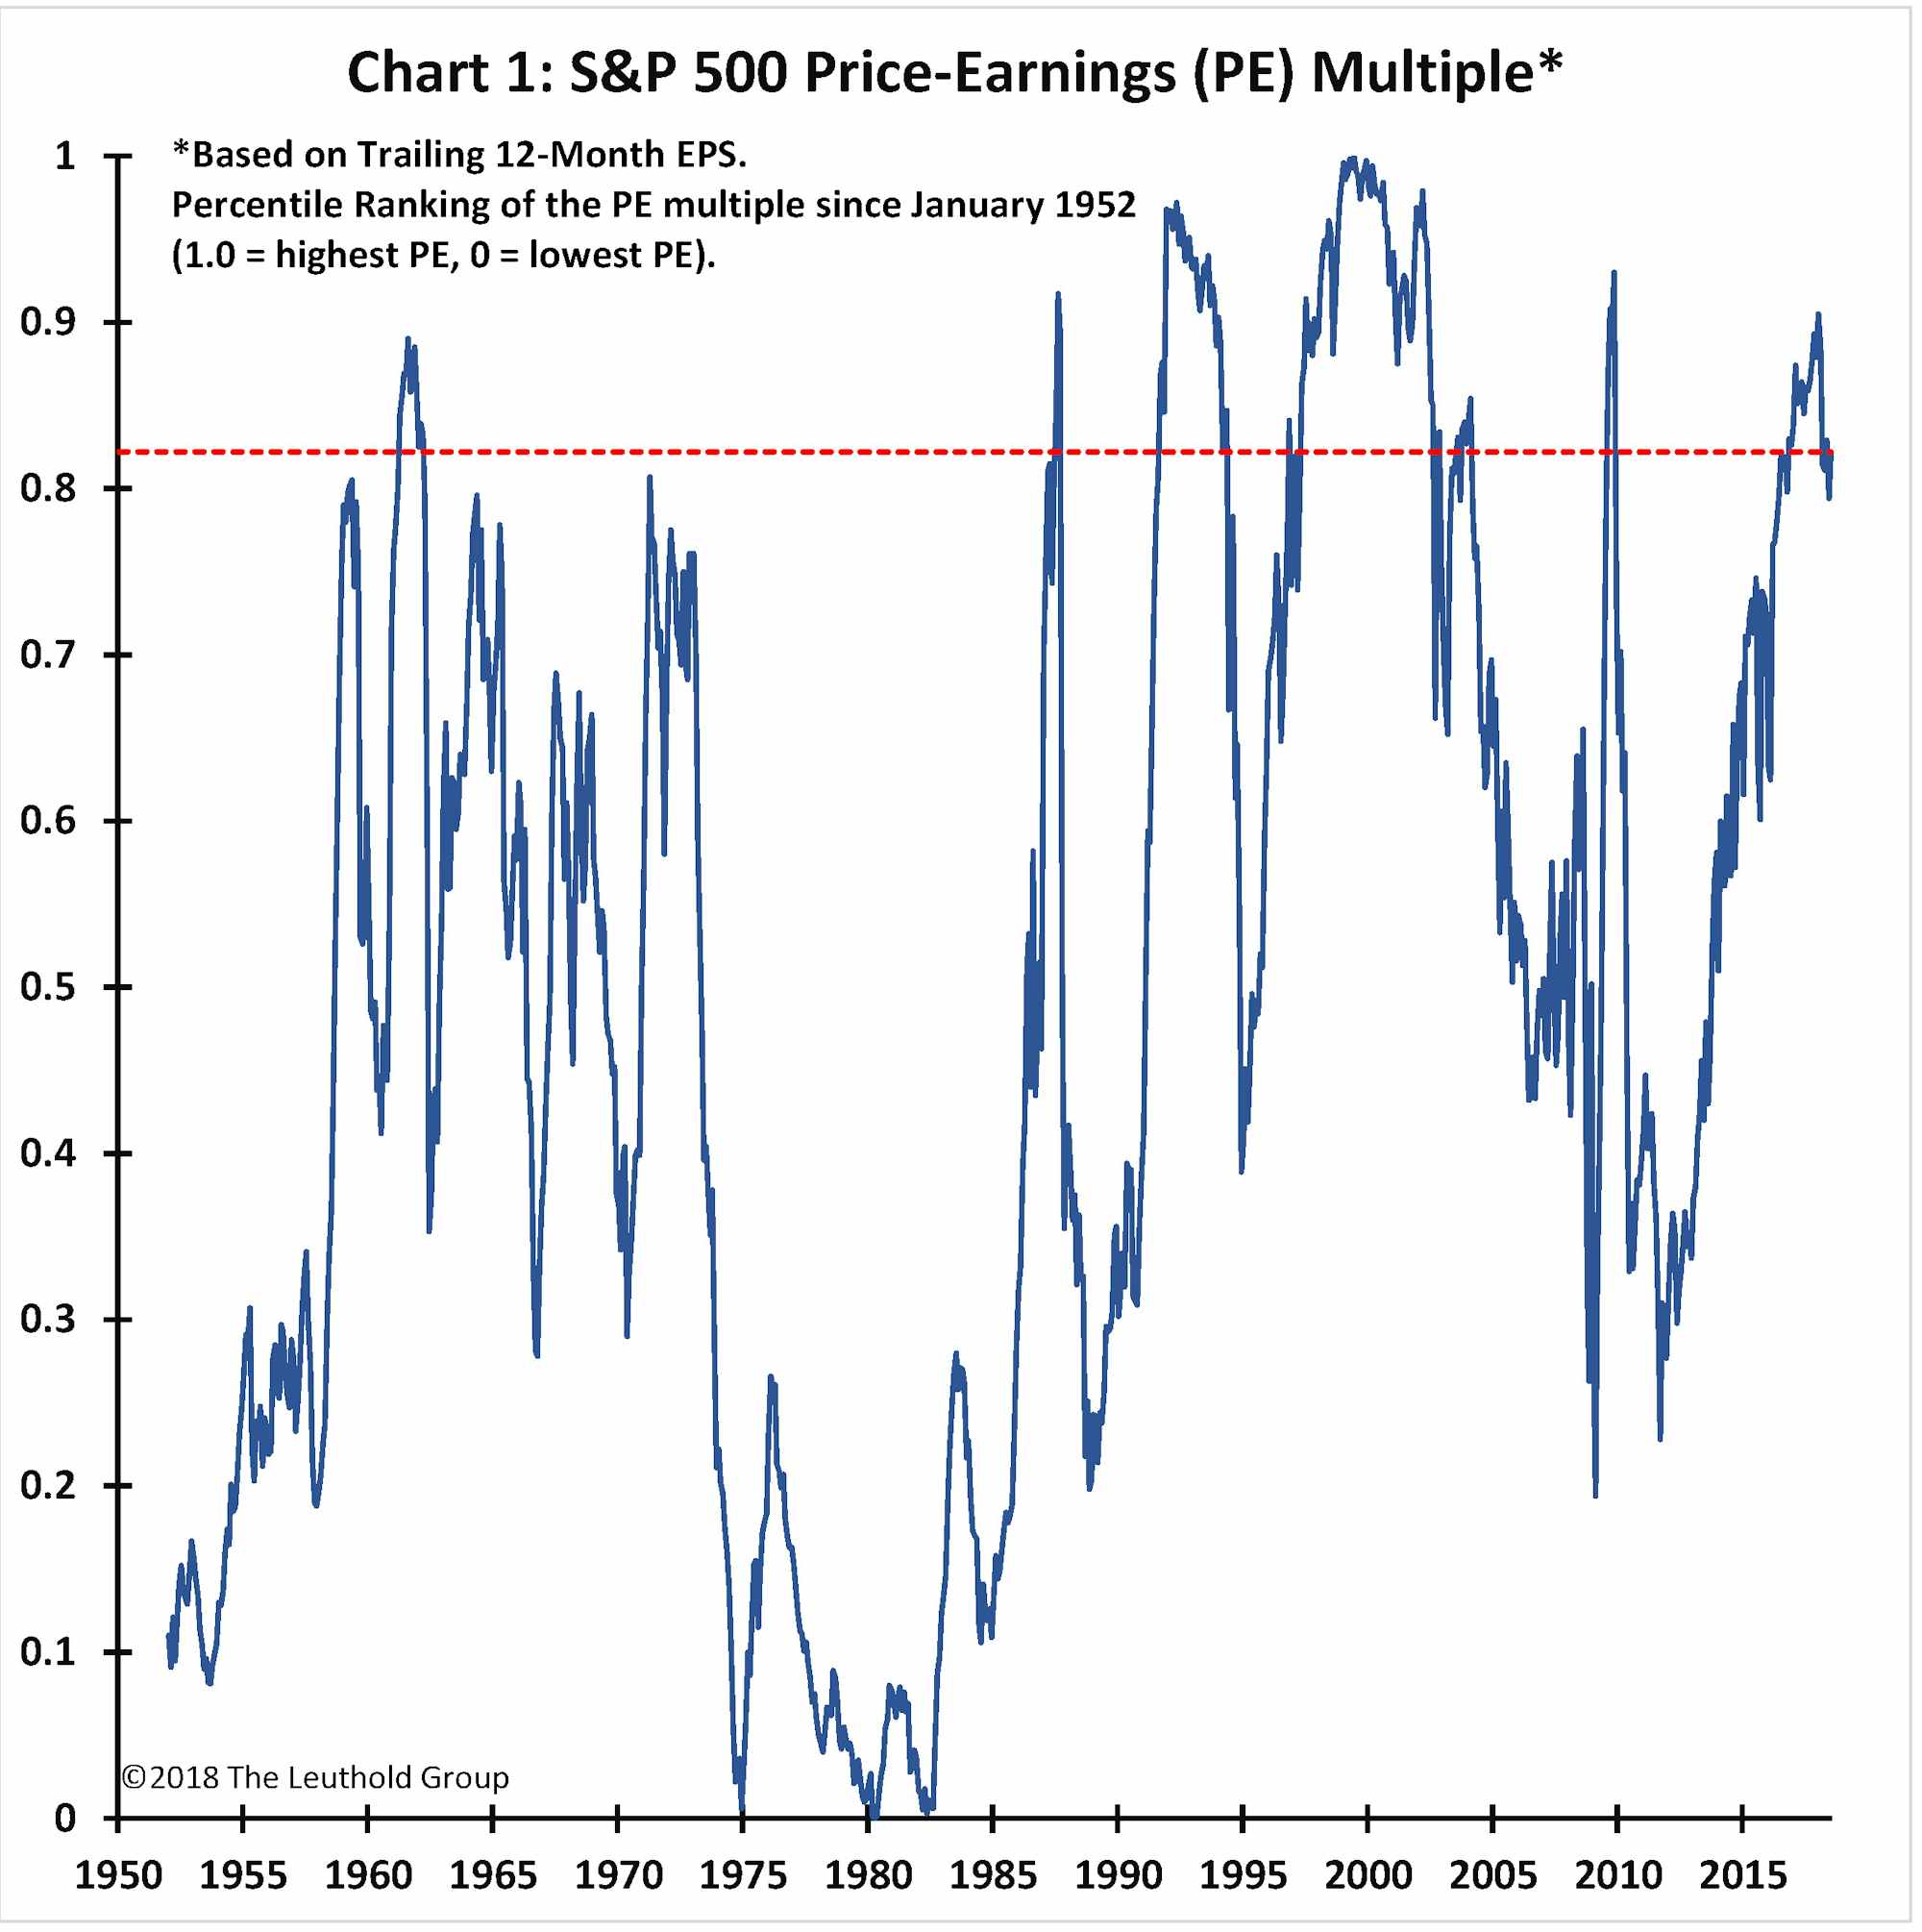
Herein we present the five components used to estimate the stock market’s utilization rate. In each case, the factors are shown as percentile rankings since 1952. Chart 1 shows the percentile ranking for the S&P 500 PE multiple. Currently, it is in the 82nd percentile, suggesting it is higher than 82% of the time since 1952. Although the PE multiple is in the upper quintile of its historic range, it could still rise. However, some of the PE multiples logged above today’s level were primarily the result of a temporary collapse in earnings caused by a recession. Consequently, today’s PE may be much closer to max capacity than Chart 1 implies.
The percentile ranking of the 10-year Treasury bond yield is shown in Chart 2 (1.0 represents the lowest bond yield in post-war history, whereas 0 represents the highest yield). Clearly, after a 35-year secular decline, bond yields have exhausted much of their potential to fall.
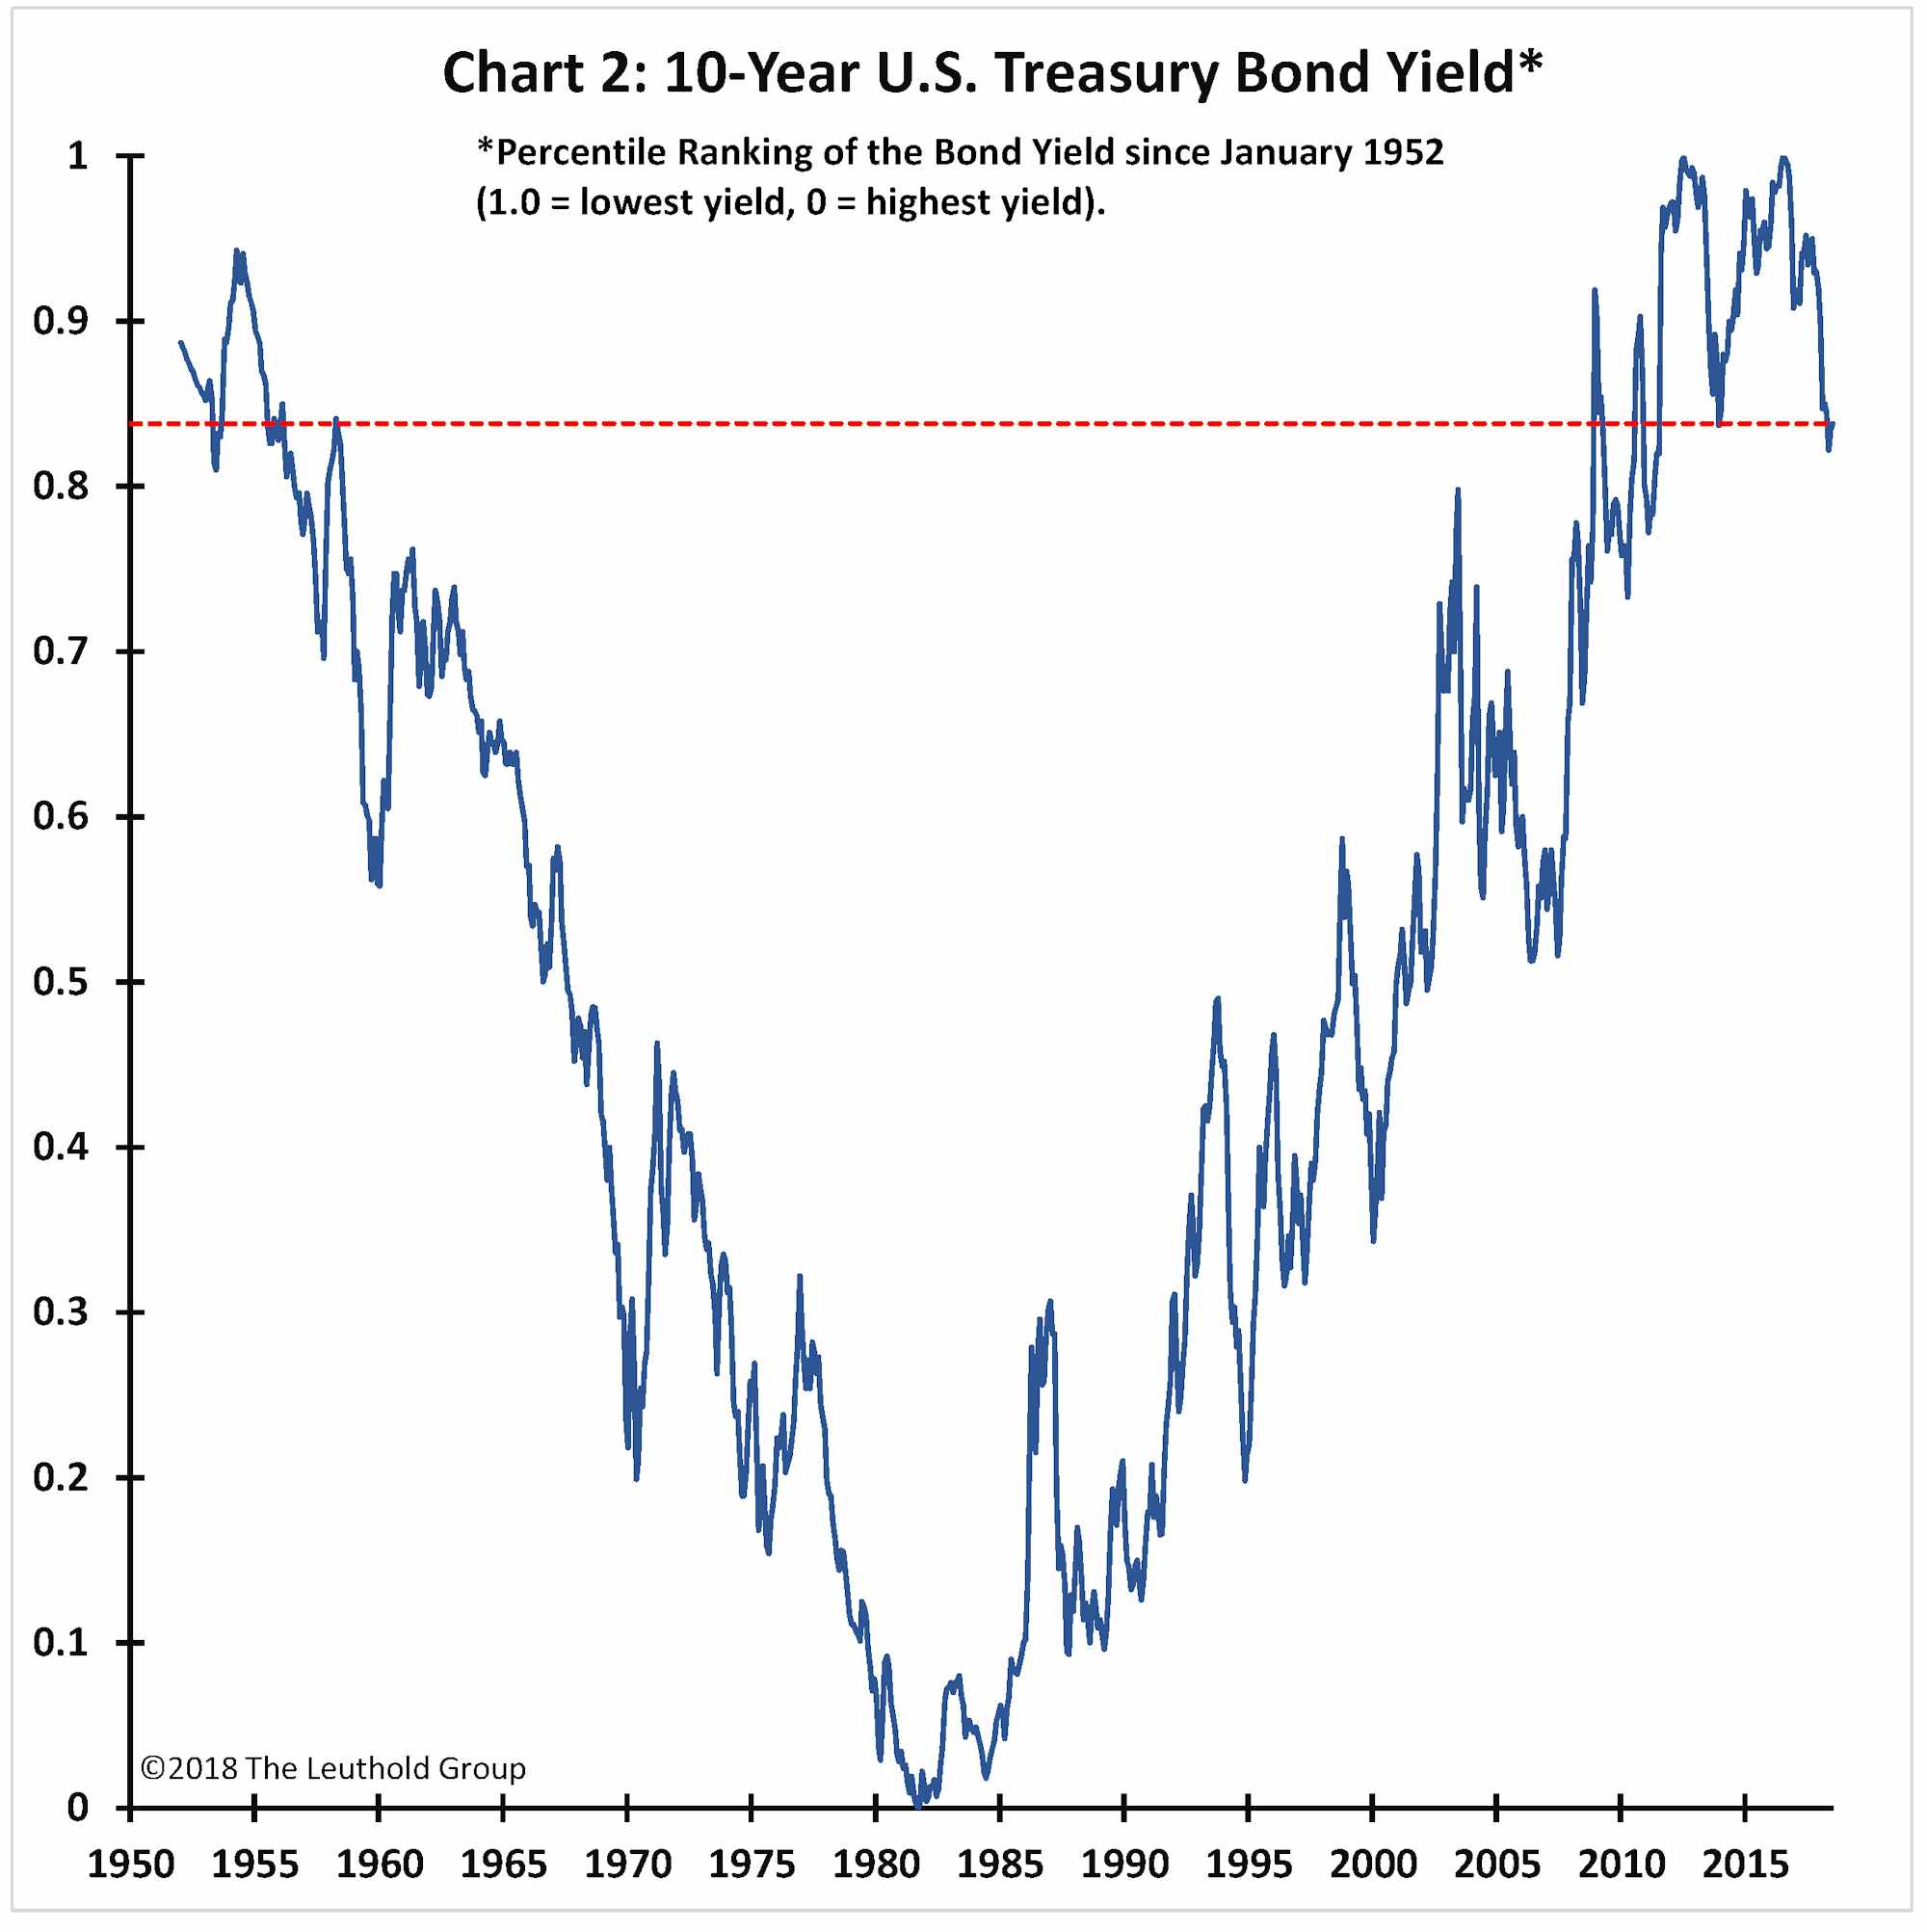
It is interesting to compare the 1950s’ bull market to that of the 1980s’. At the start of the 1950s, despite bond yields already near maximum capacity for the stock market (i.e., bond yields could not fall much lower), stocks still did quite well in that decade even though bond yields rose. This was because, while yields were at maximum capacity, the PE multiple (Chart 1) began that decade near record lows. By contrast, the 1980s’ bull market was driven by maximal excess capacity in both stock market valuations and in bond yields.
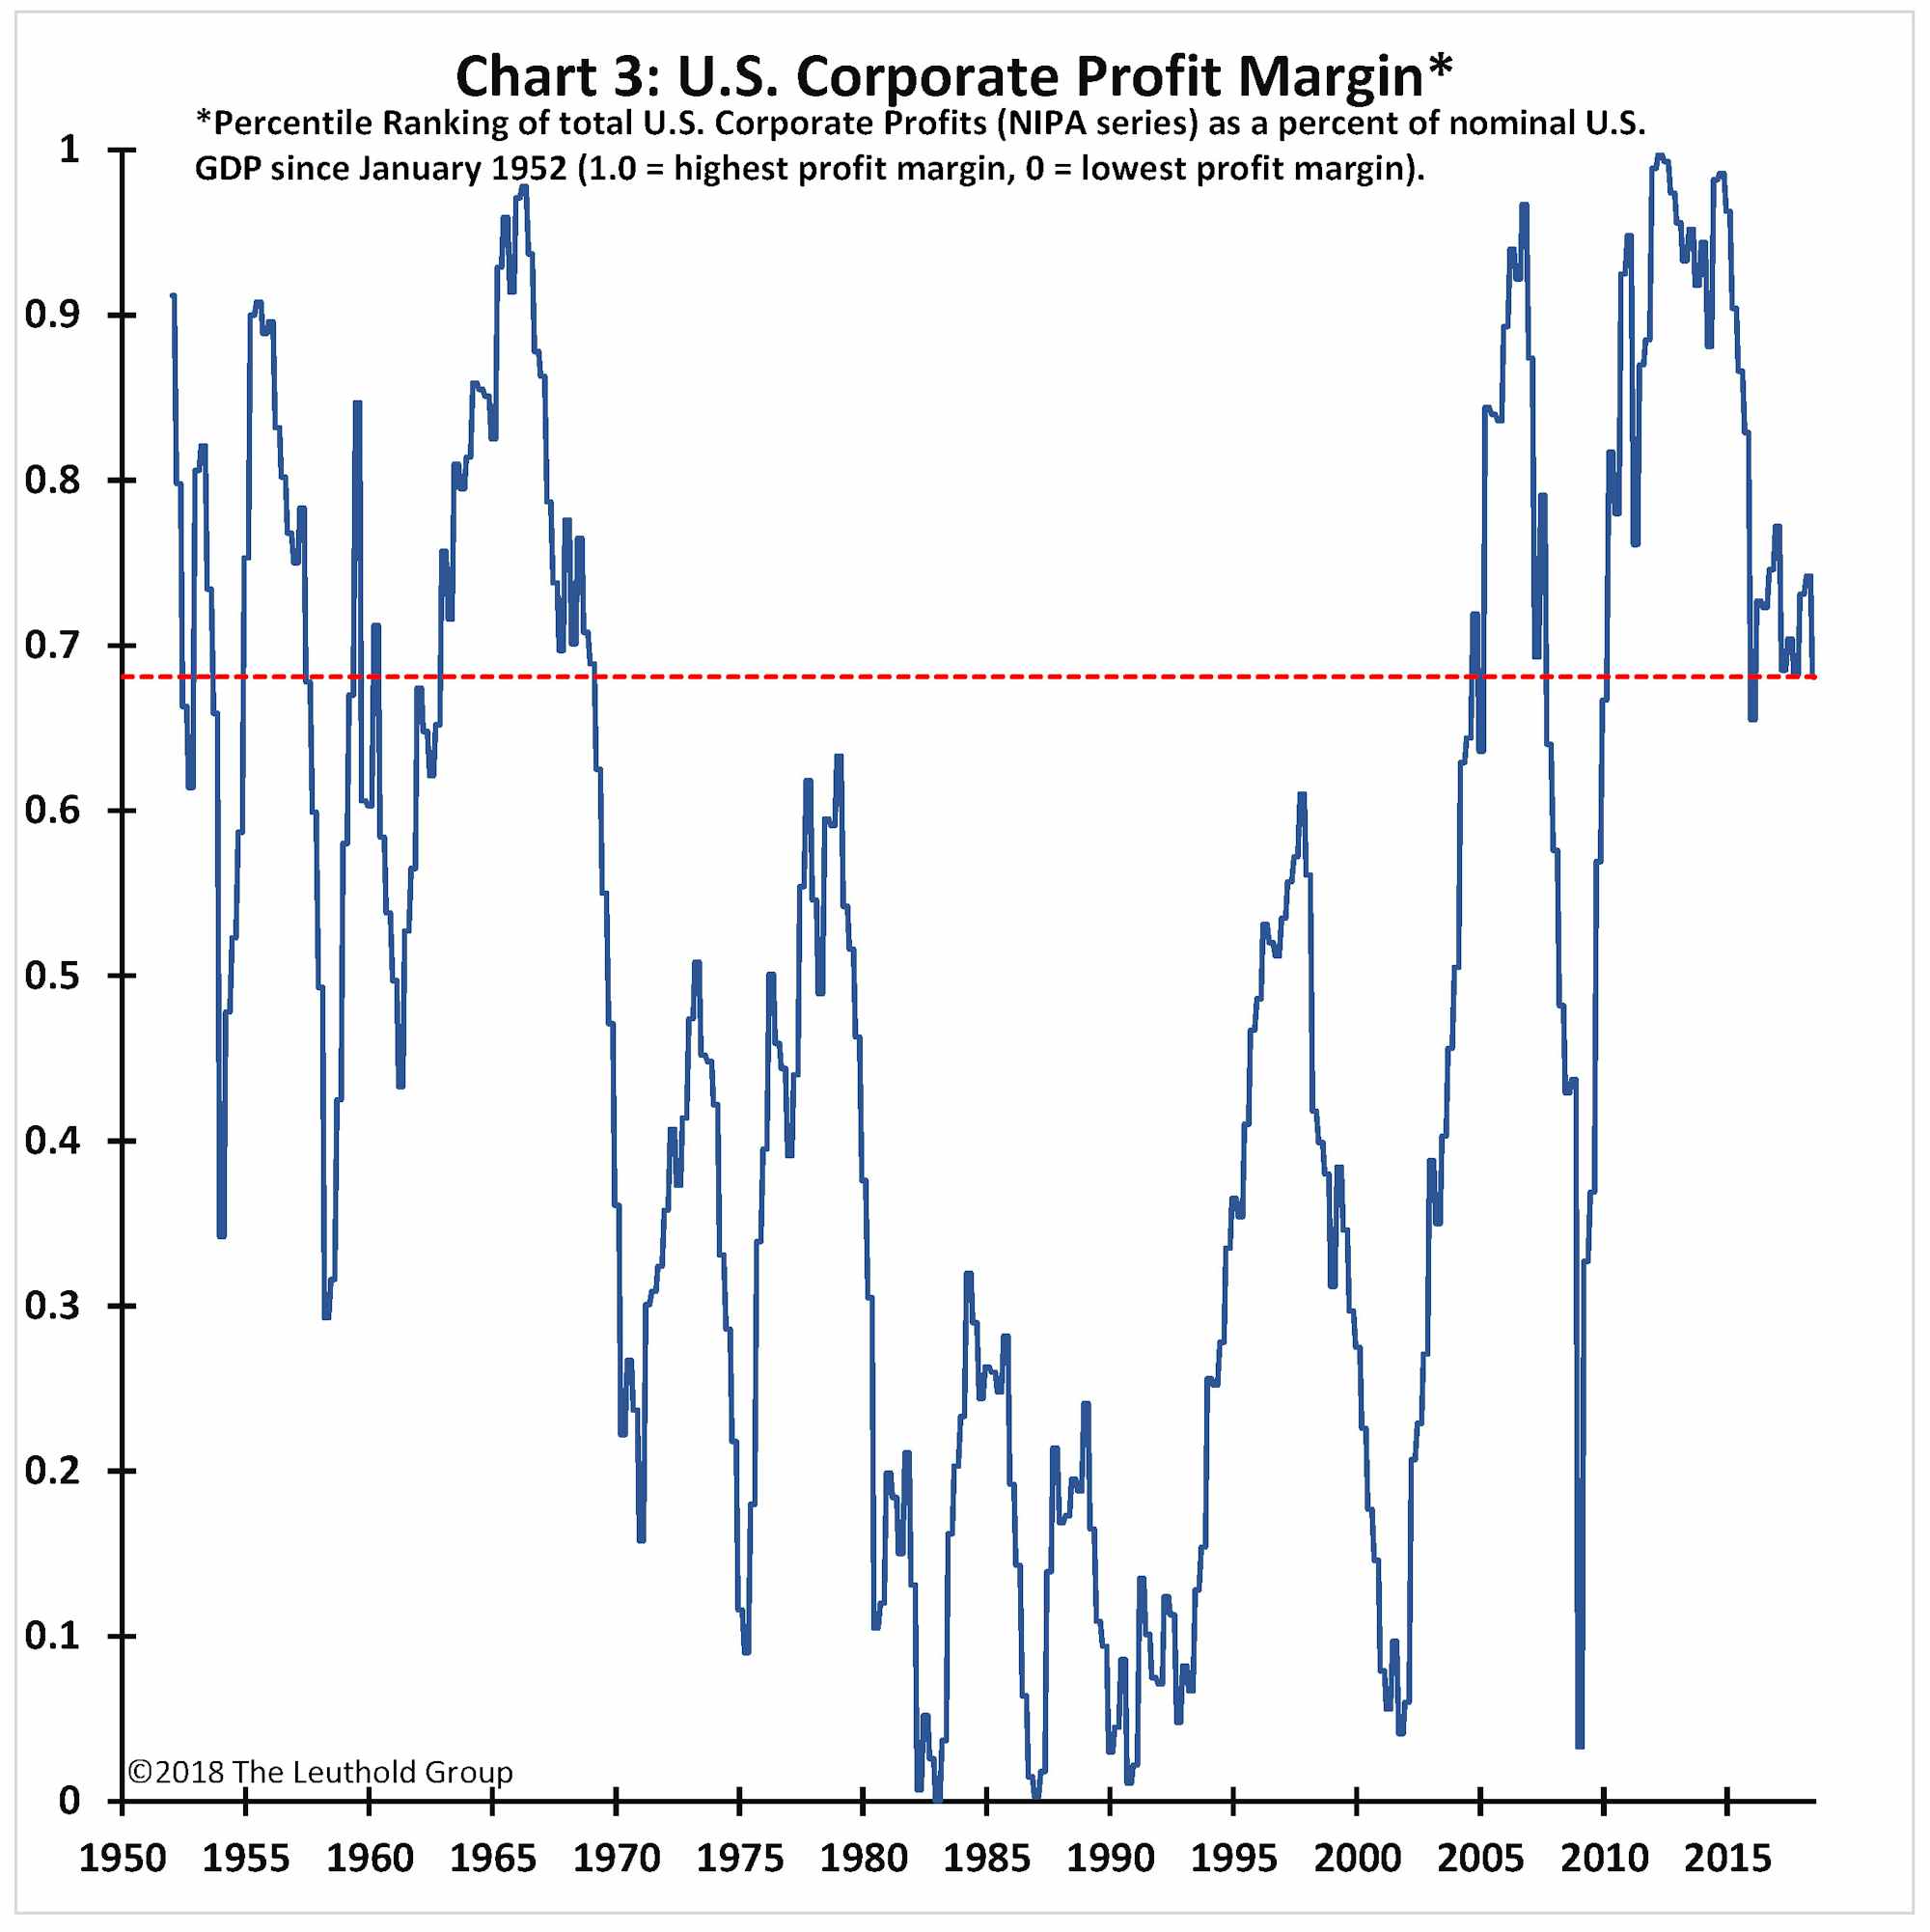
The capacity of the profit cycle is illustrated in Chart 3. Profit margins reached a post-war record early in this recovery and, while they remain elevated relative to historic norms, they have declined some in the last couple years. Currently, they are higher than about 68% of the time since 1952, suggesting some upside potential. However, this measure of profit margins is based on total U.S. profits relative to nominal GDP. S&P 500 profit margins currently reside at post-war record highs! Moreover, because the economy is at full employment, companies are likely to struggle with intensifying cost pressures.
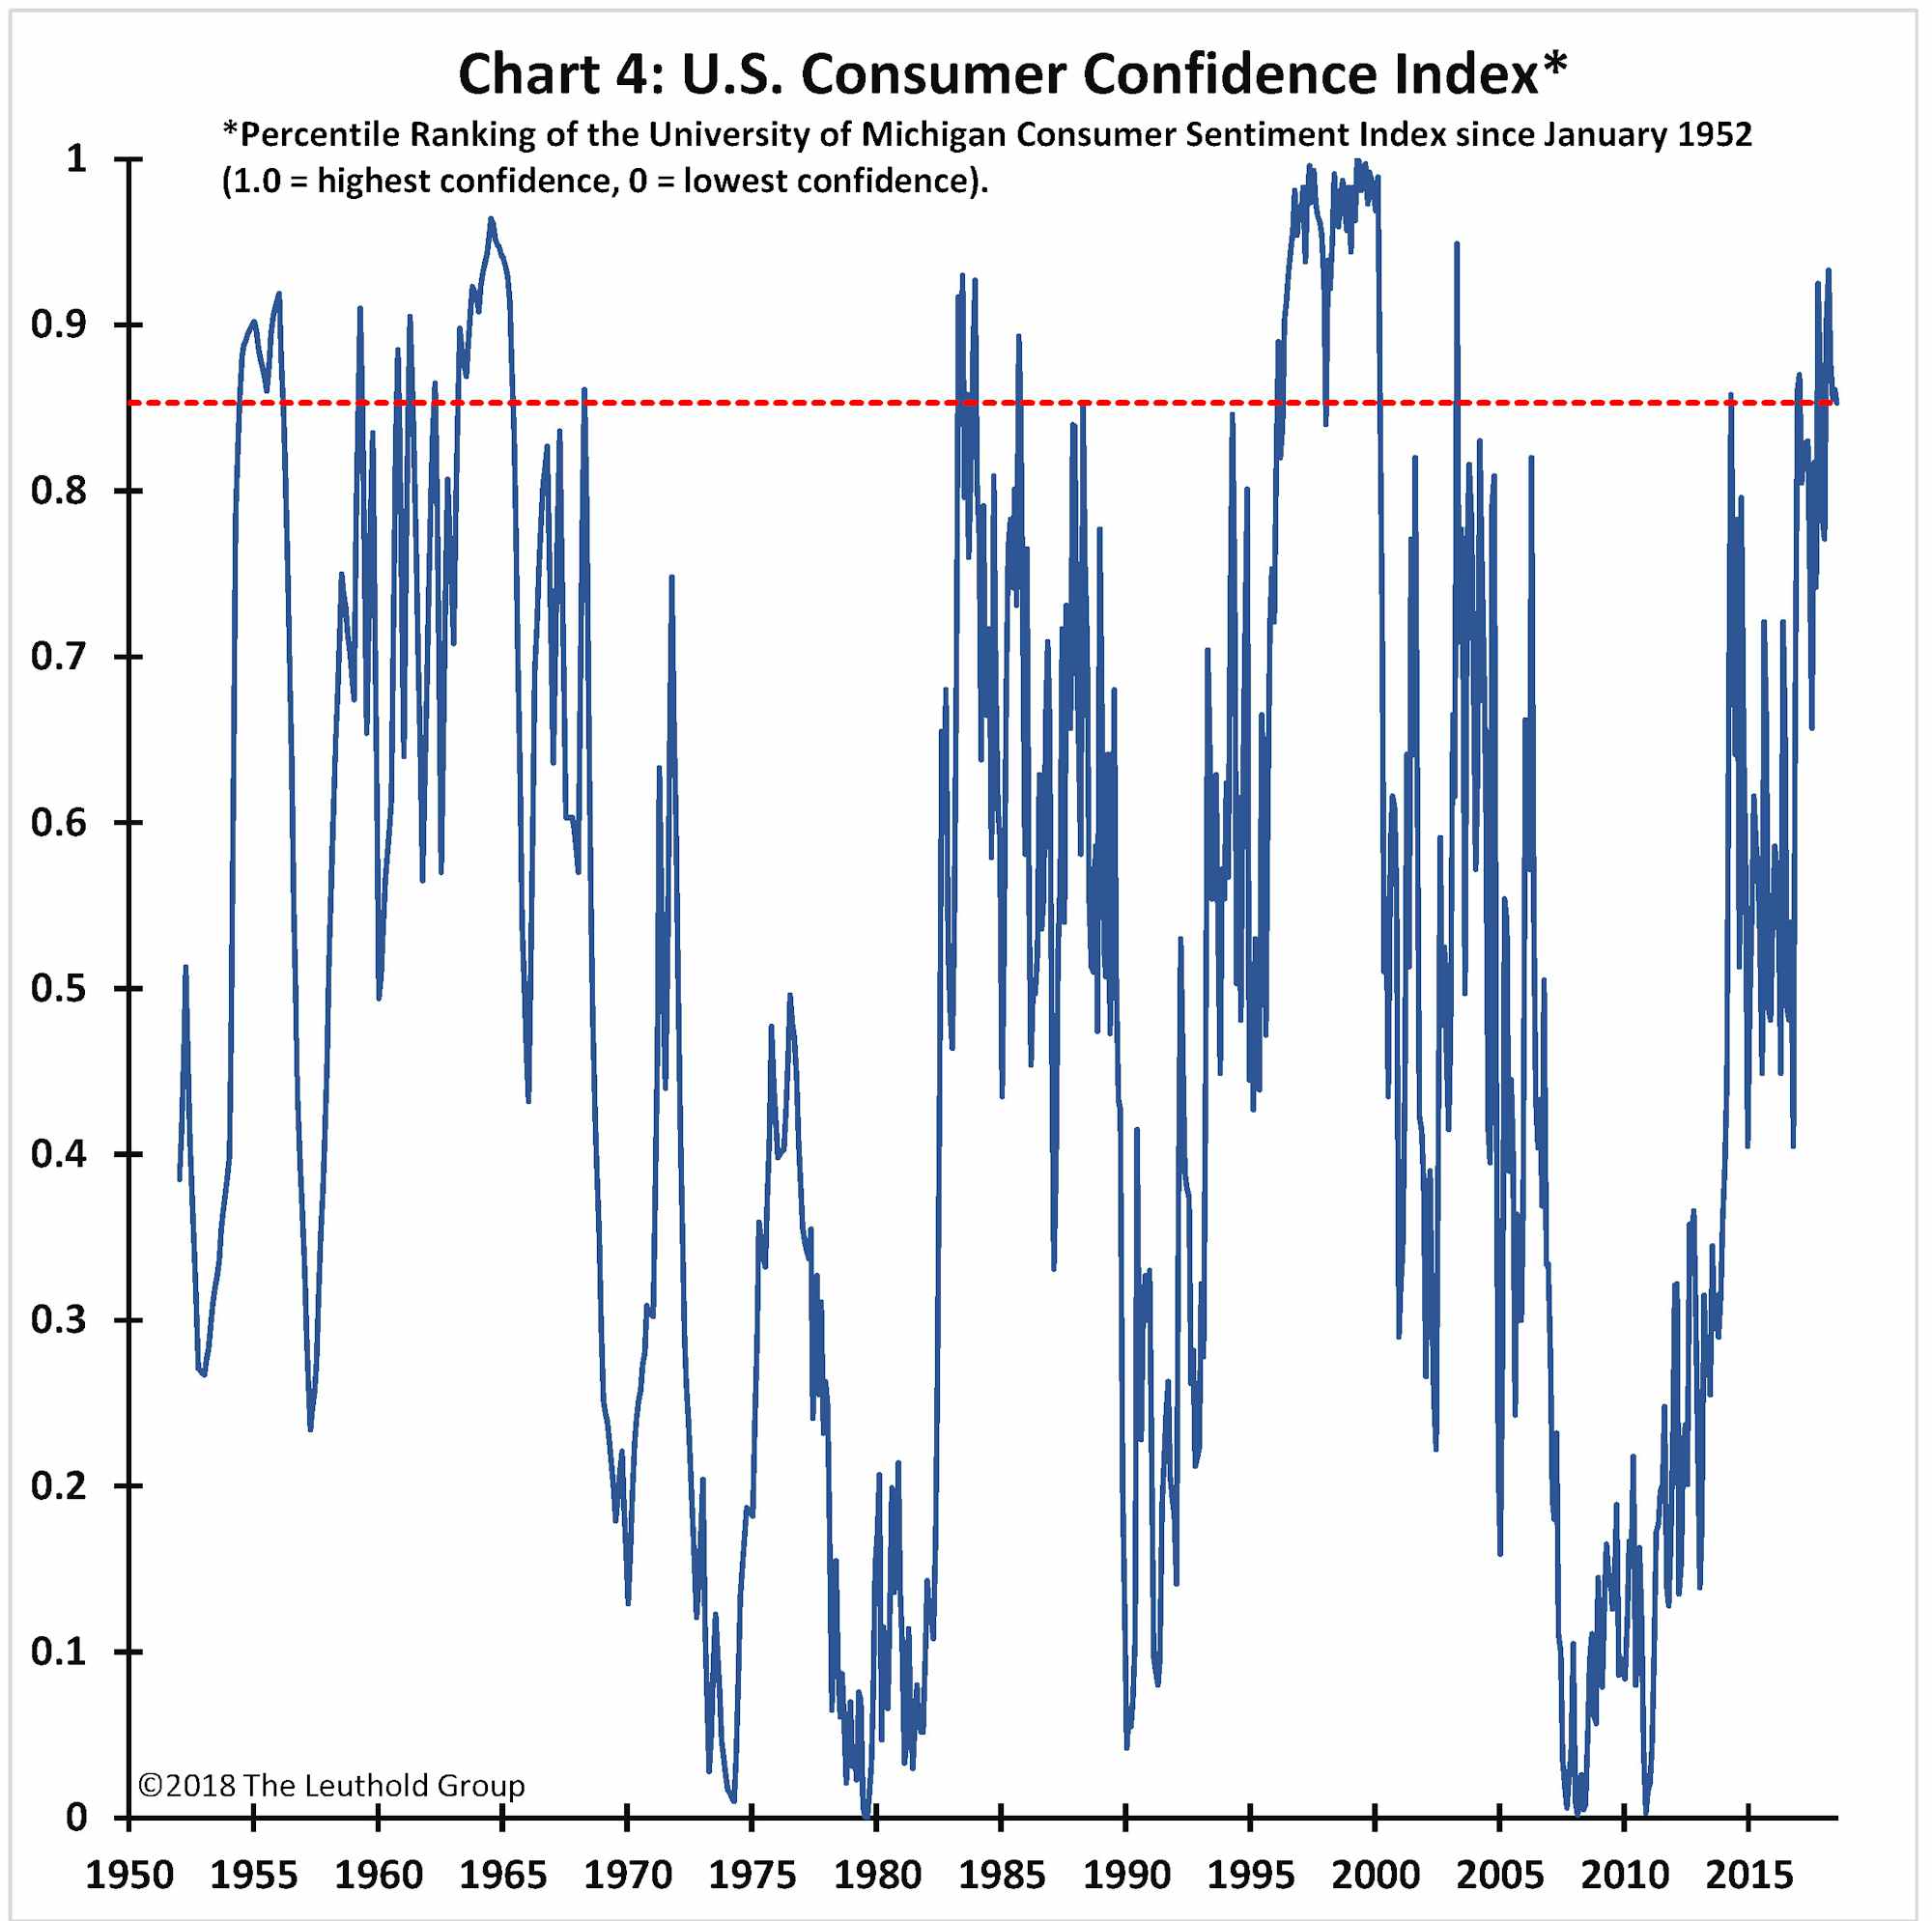
As shown in Chart 4, the level of confidence is currently higher than 86% of the time since 1952. After the presidential election, confidence surged from about mid-range, historically, to upper-quintile readings and its potential to increase further is now limited.
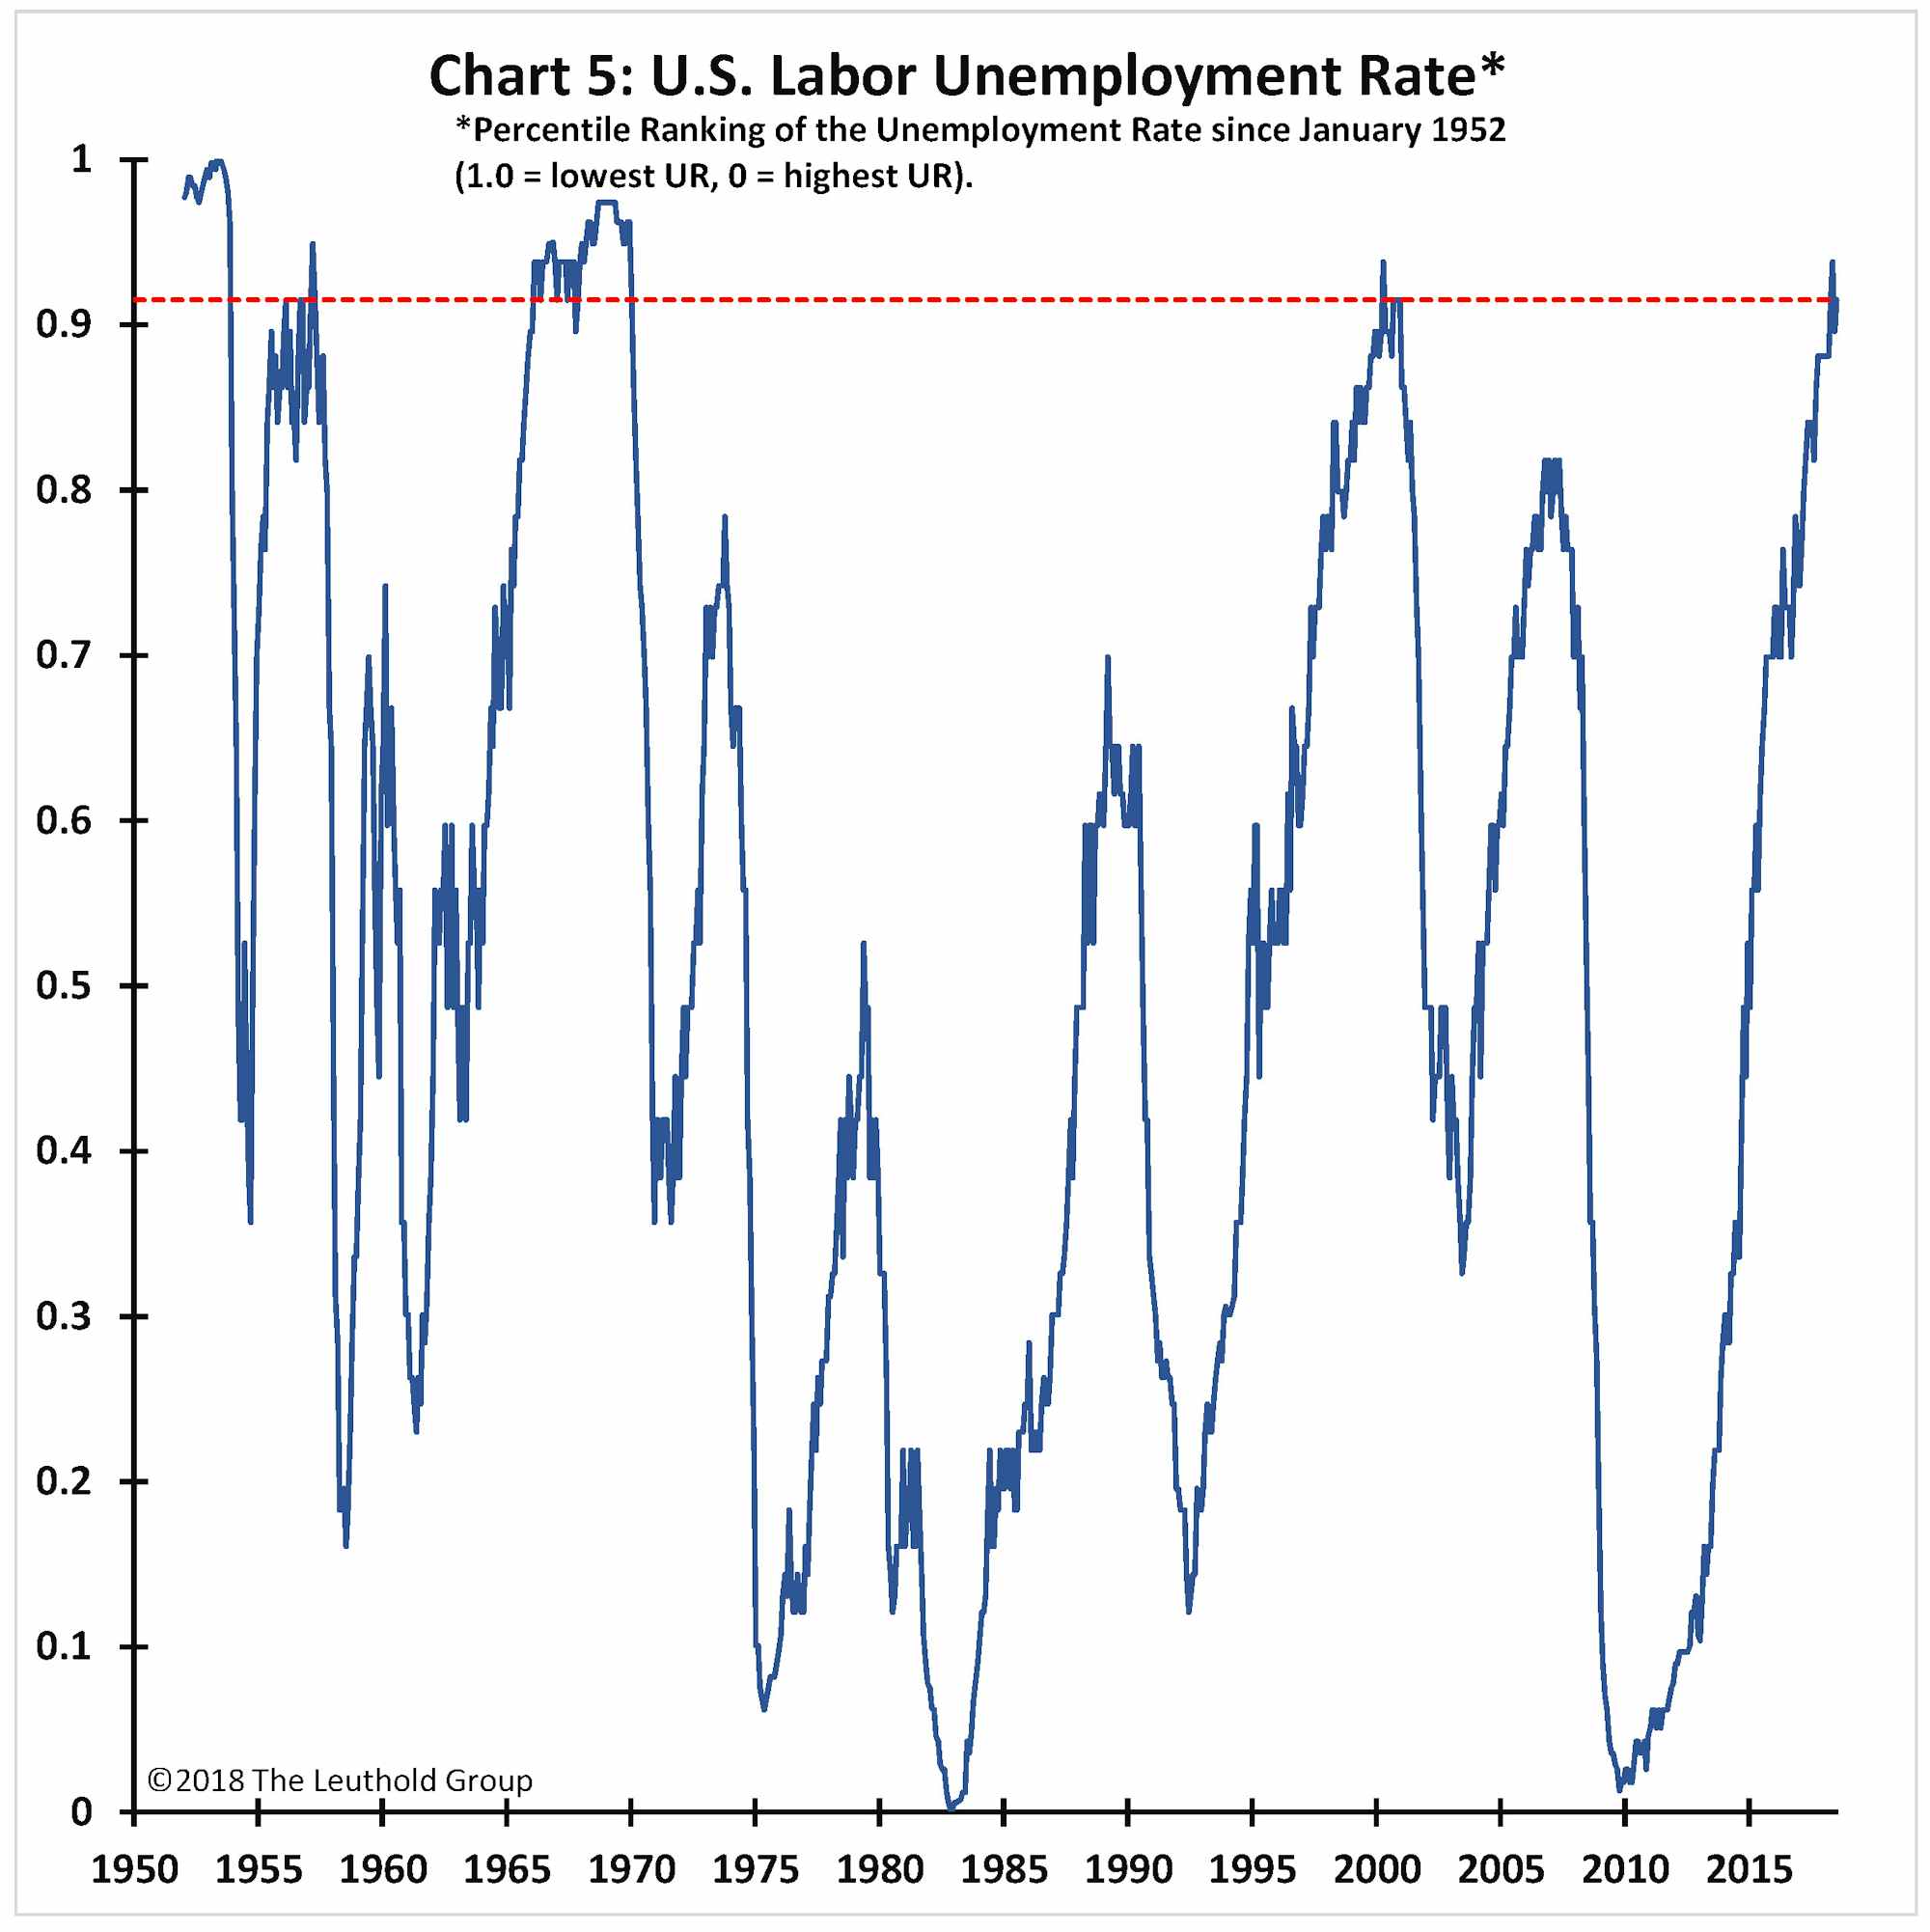
Finally, the percentile ranking of the unemployment rate shown in Chart 5 approximates the degree of slack left in the economy. A low percentile reading (i.e., a high labor unemployment rate) signifies considerable capacity for the stock market to be boosted by improved economic growth without significant inflation or interest rate pressures. However, the current unemployment rate is at the 92nd percentile of its historic range. Although the unemployment rate could still move lower, any further decline is likely to worsen cost-push, inflation, and interest rate pressures.
Stock Market Utilization Rate
The stock market utilization rate is the result of combining these five factors into a single indicator. Chart 6 represents the average of the historic percentile rankings of the PE multiple, the 10-year bond yield, corporate profit margins, confidence, and the labor unemployment rate. As shown, the utilization rate reached a record high in October 2017 and is currently slightly above 0.82!
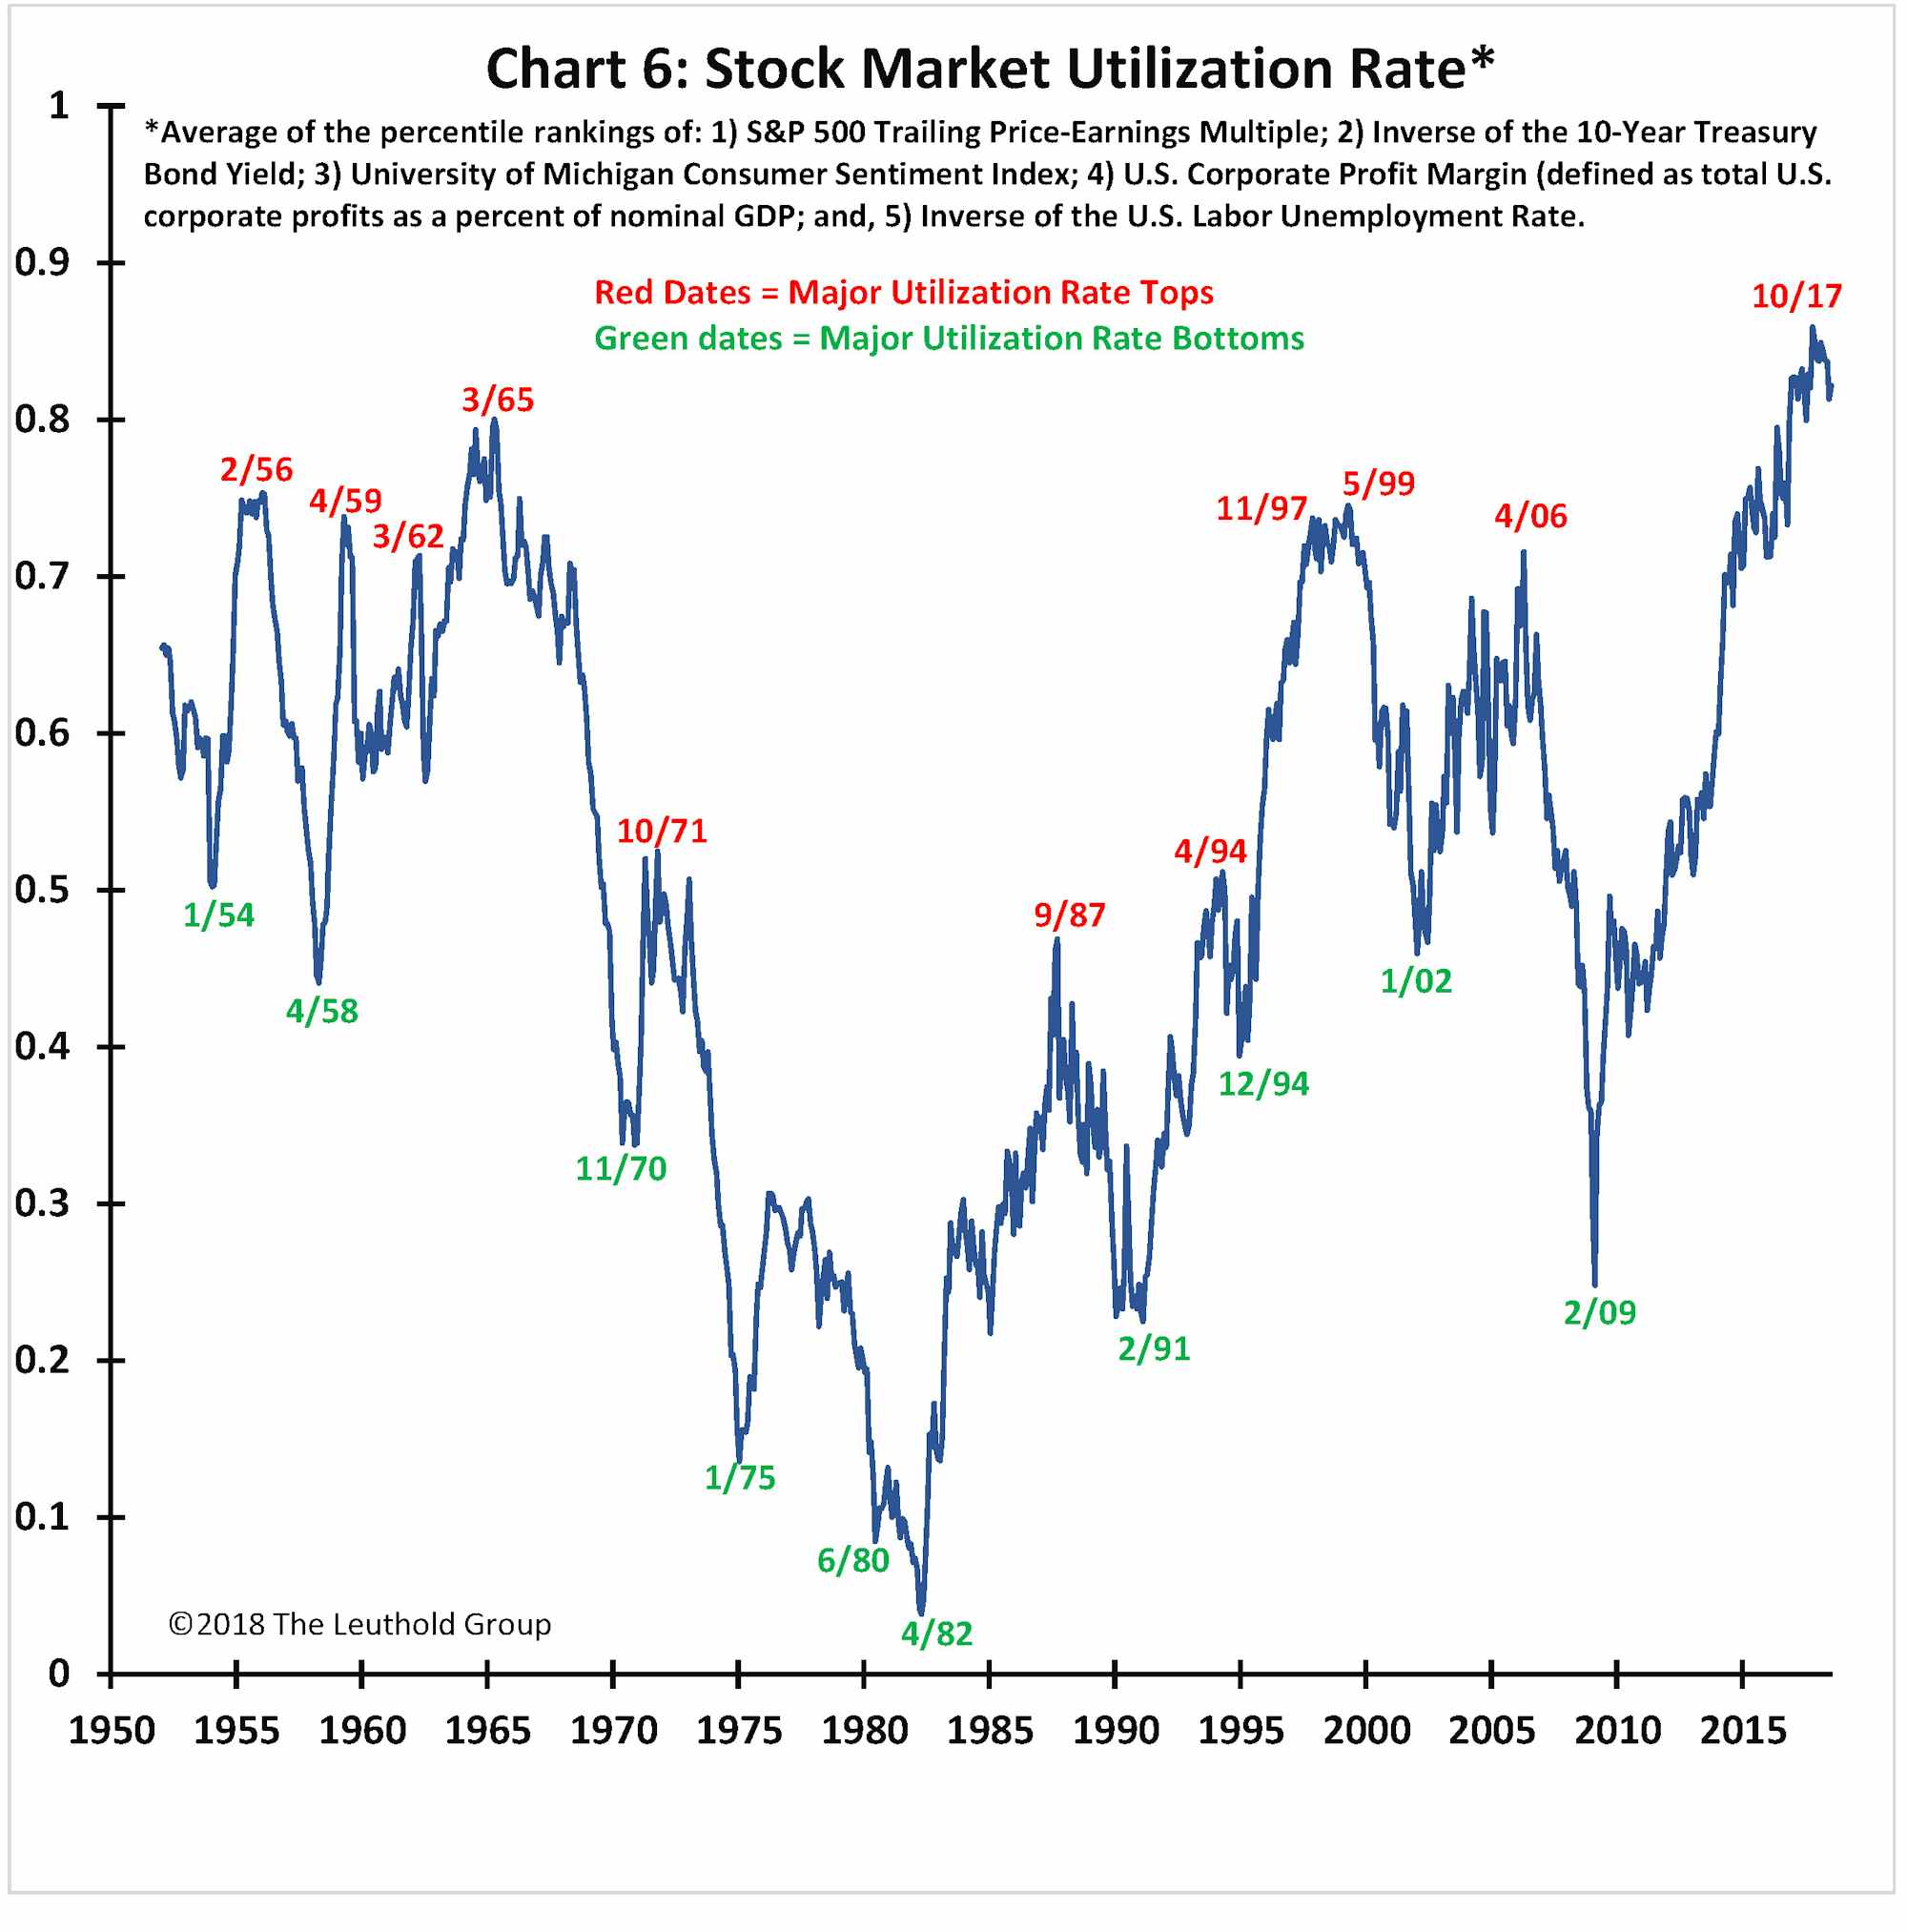
The chart dates major highs and lows in the utilization rate since 1952. Most significant bottoms have occurred when the utilization rate was less than 0.5, and most major tops have peaked with a utilization rate above 0.5. That is, the utilization rate matters! A few points are noteworthy.
First, although the current PE multiple is lower than where it peaked in 2000, the overall utilization rate is much higher today. At the dot-com top, bond yields were only at about the 50th percentile (i.e., still ample room to decline) and profit margins were much lower. Today’s stock market utilization is more like the mid-1960s. Then, the overall utilization rate was about 0.8, just slightly below today’s reading. Moreover, the PE multiple, profit margins, confidence, and the unemployment rate were nearly equal to where they are today. The only significant difference is that bond yields were slightly higher in 1965 (i.e., the 10-year yield was about 4.2%).
Second, Chart 6 offers another reason (beyond the housing bubble) why the last recovery ended. The bull simply ran out of capacity. Interestingly, as bad as the dot-com collapse was, it did not “refresh capacity” nearly as much as did the 2008 crisis (it only took the utilization rate down to about 0.45 in 2000, whereas it declined to almost 0.2 in 2009). And, consequently, by 2006, the utilization rate had returned to nearly the same level it reached in 1999.
Third, one of the reasons the contemporary bull market has been so long-lasting and its performance so good, is because it had outsized capacity from its start. Both the 1990s’ bull and the current bull began from utilization rates near 0.2. The only major bulls which started from a lower utilization rate were the 1975 and 1982 bull markets. It is also interesting how long it took for the current bull market’s utilization rate to increase significantly. In early 2014, about five years into the bull market, the utilization rate was still below 0.6. Only in the last few years has stock market utilization risk become meaningful. It did not rise above 0.7 (an upper-quintile reading) until late 2014.
Finally, while the PE multiple is currently lower than about 20% of the time since 1952, the utilization rate is at a record! The PE multiple may be below dot-com levels, but it has never been this high when bond yields are near all-time lows, the economy has returned to full employment, and company profit margins are near maximal levels.
Current Utilization Rate Suggests 5%-ish Long-Term Returns!
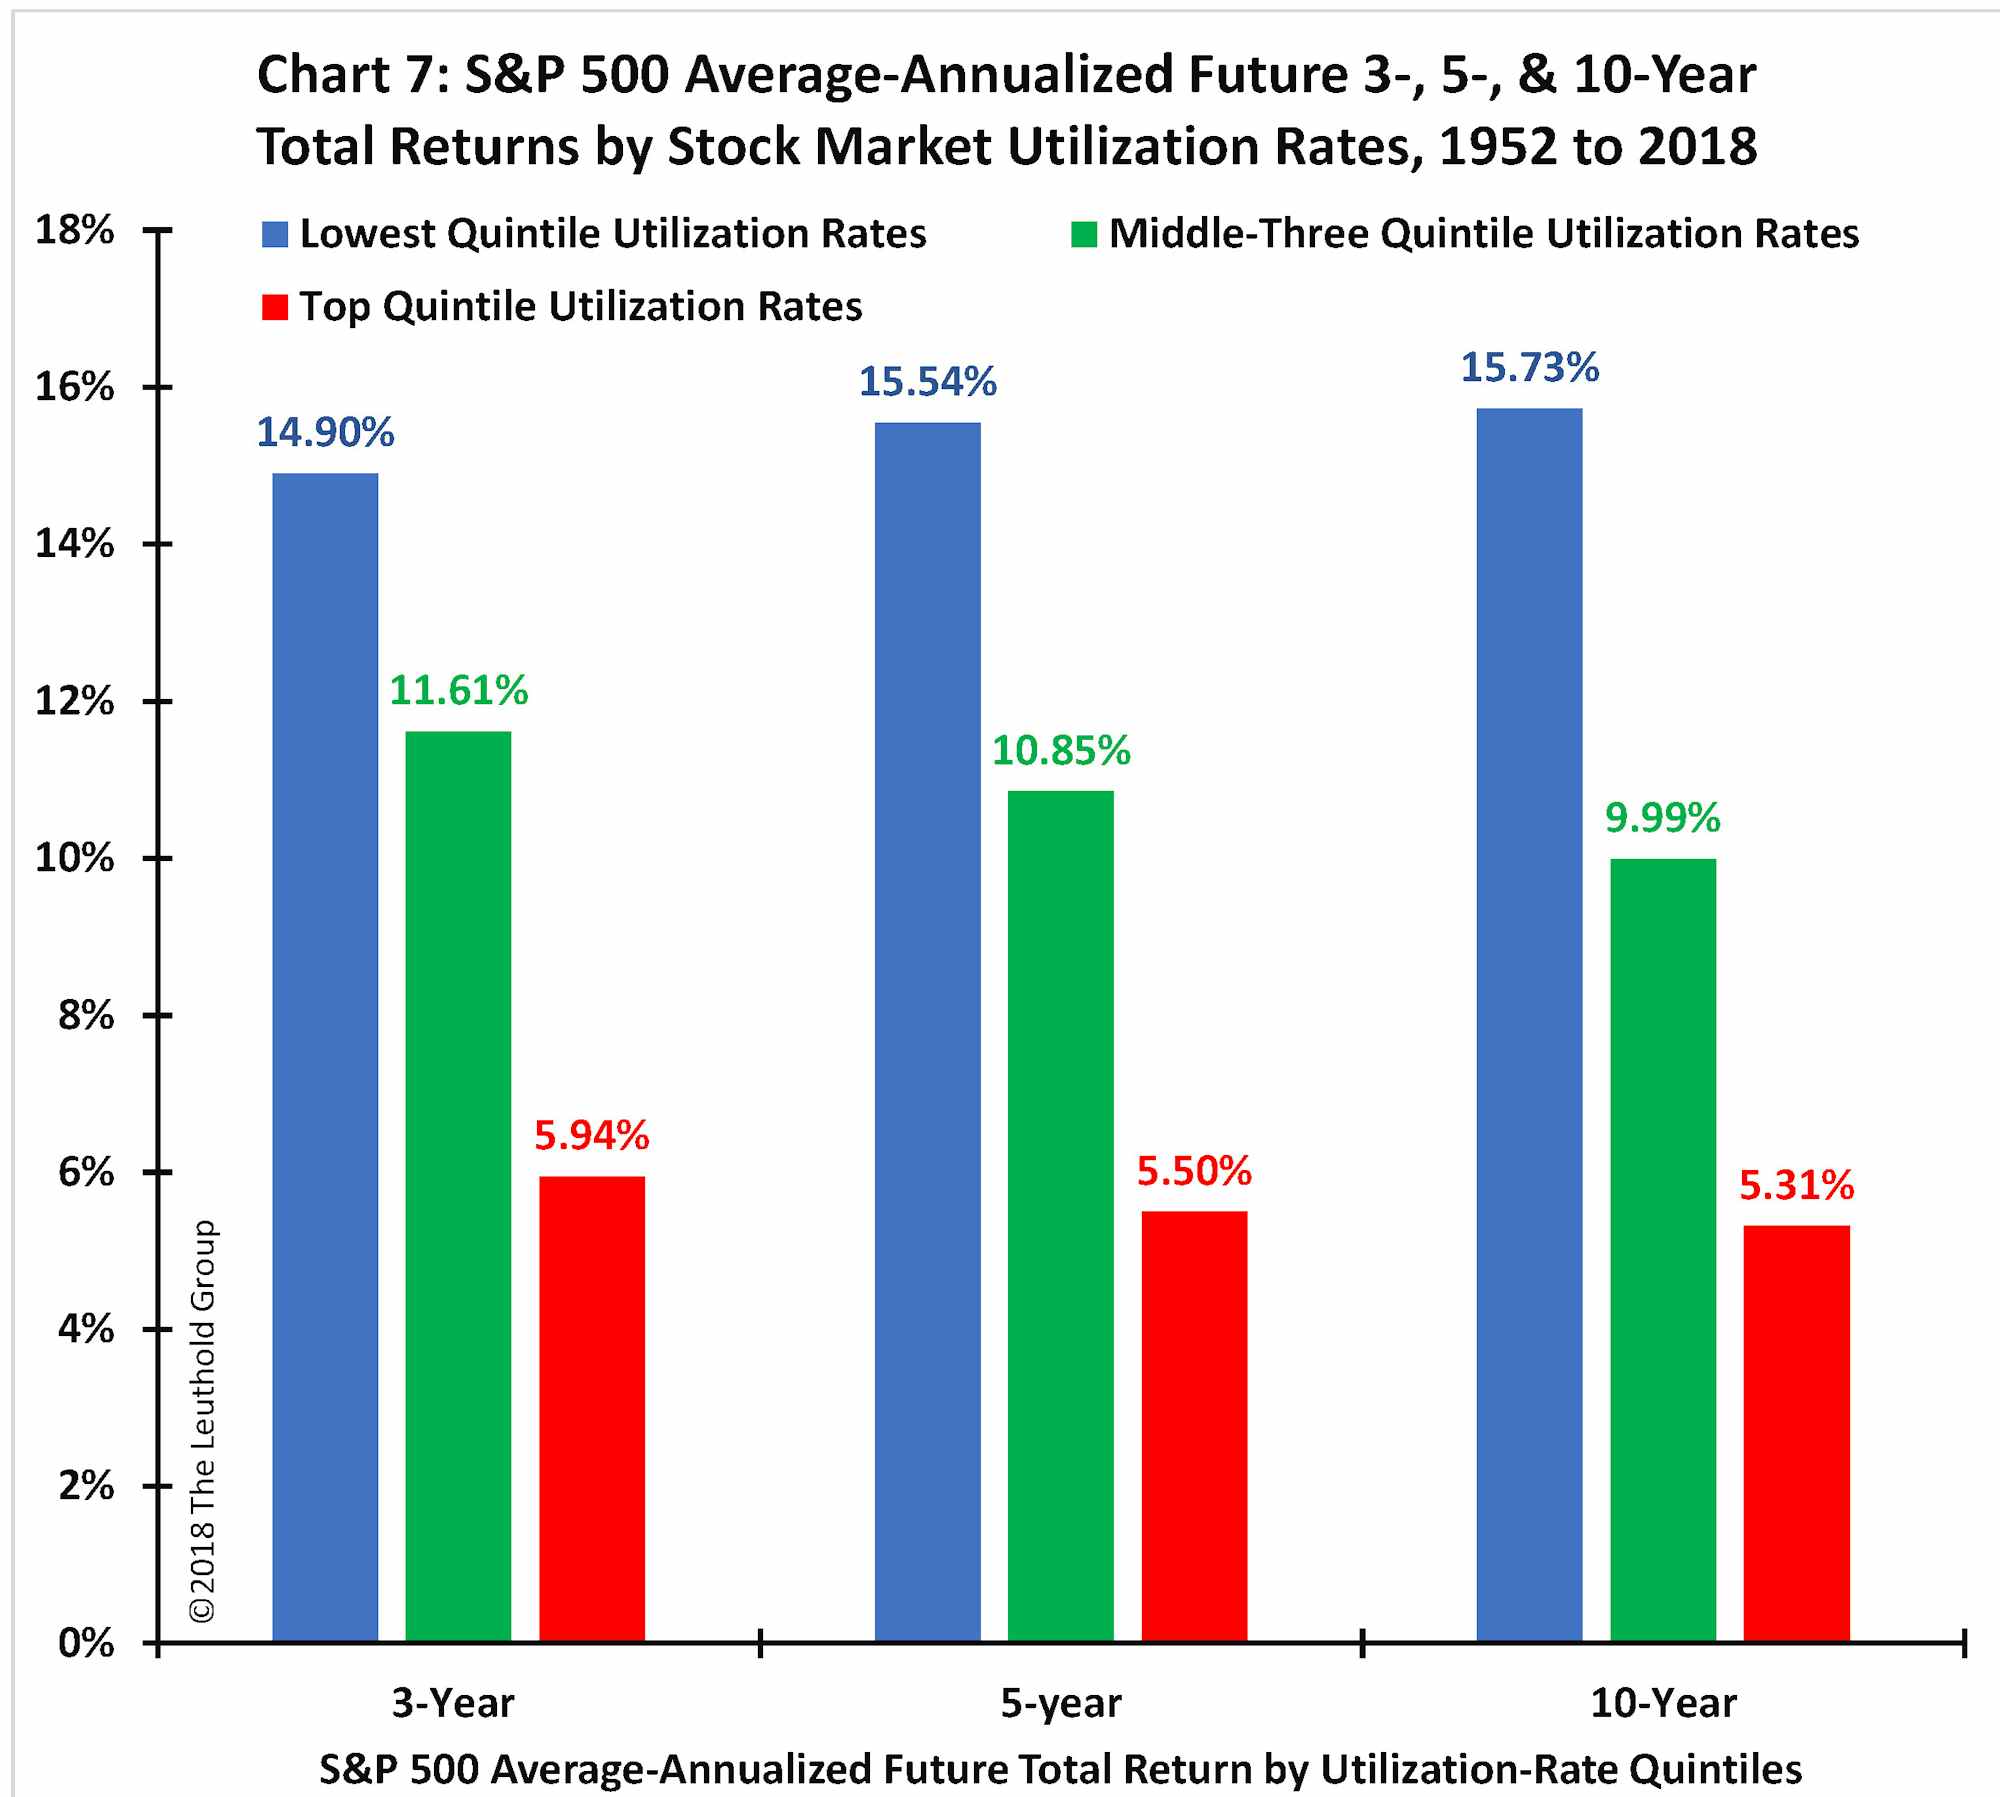
While a record-high stock market utilization rate does not necessarily indicate an imminent bear market, it does suggest lower future return potential for the stock market. As shown in Chart 7, since 1952, the forward 3-, 5- and 10-year stock market average-annualized total returns have only been about +5.5% when the utilization rate is in its upper quintile as it is today. By comparison, it has produced returns of about +11% when in the middle-three quintiles, and about +15% annualized returns when in the lowest quintile.
Because the stock market utilization rate is currently near a record high, we recommend a greater level of diversification for equity investors. First, consider increasing your tilt toward both developed and emerging market international equities (neither has as high of a utilization rate as the U.S. stock market).
Second, raise some cash to be used opportunistically should the stock market hit an air pocket. Third, buy a commodity ETF which currently offers an improved risk-return profile since the economy is at full employment. Fourth, introduce some hedge-fund tactics (which probably offer buy-and-hold returns comparable to a capacity-challenged stock market, but with less downside risk). Fifth, add a little gold to your portfolio—currently cheaply priced—as a buffer against a potential investor panic. Sixth, barbell sector exposures among some cyclical sectors (e.g., Energy, Materials, Industrials, Financials) and some traditional defensive sectors (e.g., Utilities, Staples). Finally, De-FAANG your portfolio and sell those select few, over-popular new era names.
Summary And Conclusions
The stock market utilization rate is not a timing tool. Simply because it is currently at a post-war high does not imply a bear market is imminent. Rather, it focuses attention on its remaining potential. Whether it lasts several more years or only a few months, the record-high stock market utilization rate suggests subpar returns in the balance of this bull market because its capacity is already depleted.
Valuations may not be record setting, but they are high. Falling bond yields, a primary catalyst for this bull market during the last nine years, is all but exhausted. With the economy at full employment, additional improvements in the pace of economic growth are only forthcoming with broader cost-push, inflation, and bond yield pressures which are likely to worsen both profit margins and PE valuations. Gone is the perpetual wall-of-worry which framed much of this bull market. Confidence measures among both businesses and consumers have returned close to post-war highs, and at best, investor sentiment is now complacent. Finally, the corporate profit cycle is well past its best since margins have little room left to rise.
The Bull market has risen more than four-fold and is the longest ever in U.S. history. It has been driven by a massive recovery in profits, a return to full employment, a record decline in bond yields, a surge in economy-wide confidence, and a major advance in the stock market’s PE multiple. Simply, the Bull has exhausted its capacity to rise!
At best, the major factors underlying the stock market will simply maintain their respective lofty levels. Less optimistically, some of the foundations for the current bull market may begin to erode—perhaps even quickly and sharply. Therefore, investors should consider a more conservative approach consistent with a stock market exhibiting its highest utilization rate of the post-war era.