The contemporary character of the Main Street economy has often been a harbinger of future investment returns. Specifically, the mindset of private economic players (i.e., are they confident enough to engage in aggressive behavior or are worries dominating economic decisions) and the degree of resource slack (the unemployment rate) have often provided a good indication of how the financial markets may perform during the next five years!
Amongst the daily deluge of trade war headlines, presidential tweets, nuclear negotiations, FAANG news, and pending mid-term elections, perhaps it is a good time to take a step back, forget about tomorrow, next week, next month, or even next year, and consider how the investment climate is shaping up for the next several years?
So, sit back and listen to what Main Street is saying about your portfolio in 2023!
Welcome To The Main Street Meter!
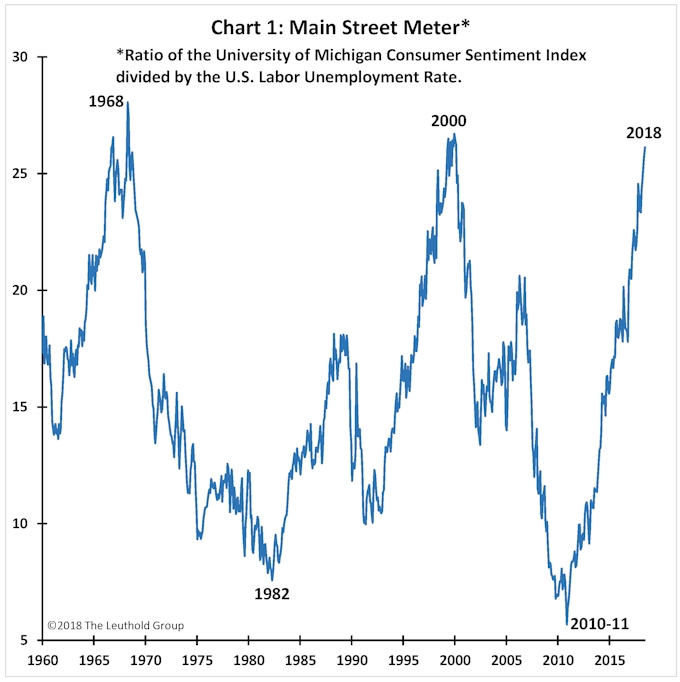
Chart 1 illustrates an informative indicator we call the “Main Street Meter” (MSM). It is the level of consumer confidence divided by the labor unemployment rate. When this ratio is high, Main Street has probably been good for a while. So good in fact, the economy usually exhibits a specific economic character in which most private players are optimistic about their future and, because of that mindset, greed (rather than fear) probably plays a bigger role in decision making. At the same time, when the MSM is high, slack in the economy is typically waning, if not nonexistent, implying that economic growth can no longer be achieved without some negative overheating consequences (e.g., cost pressures, rising inflation, higher yields, and a restrictive monetary policy).
Conversely, low readings for the MSM suggest the economy is being driven primarily by fearfulness and conservative behavior (most are hunkered down and prepared for tough times, leaving considerable buying, borrowing, building, hiring, and dry-powder potential untapped), and high levels of excess capacity which could easily handle a significant period of economic growth without aggravating negative consequences.
Essentially, the MSM is a simple proxy for the capacity utilization rate of the economic recovery. Low readings suggest ample capacity is available to drive a significant and prolonged recovery (i.e., considerable potential for player-mindset confidence to improve, and ample resources to satisfy more aggressive economic behavior), whereas high readings suggest the utilization rate of the recovery is near a peak (e.g., at best, confidence and resource utilization will remain near peak levels, but it is more probable they both worsen).
Today, with the unemployment rate near a 50-year low and consumer confidence near post-war highs, the MSM is at its third highest level since 1960! While this recovery and its associated bull market could certainly last a few more years, the capacity left in this cycle has been depleted—similar to 1968 or 2000. Although traditional recession indicators are not yet flashing red (i.e., the yield curve is not inverted, the Leading Economic Indicator is still rising, and liquidity and private debt burdens are still relatively healthy), the MSM suggests the recovery’s capacity utilization is near the top!
The MSM is not a short-term timing tool but does speak to the longer-term potential of various aspects of the financial markets. What does today’s high level of the MSM imply about the financial markets during the next several years?
MSM And The Stock Market?
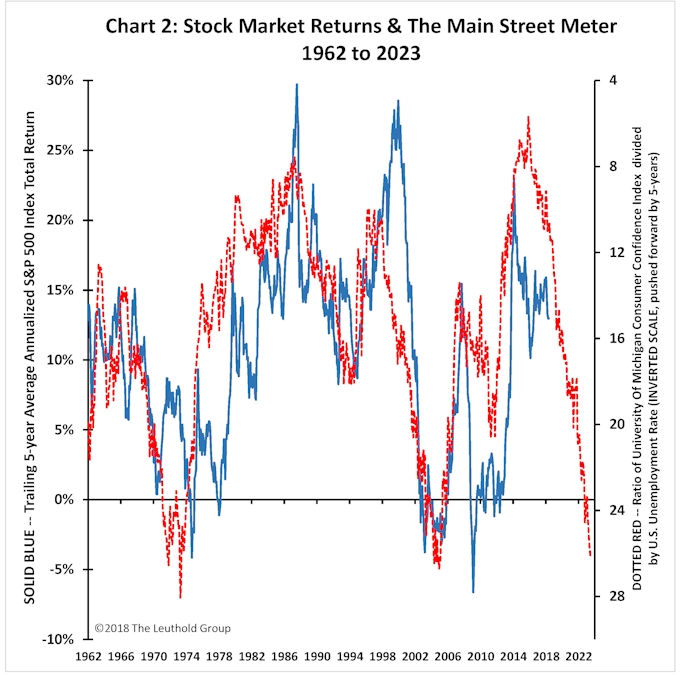
The future of the stock market is always brightest when pessimism abounds, and excess economic capacity is abundant. For example, from Chart 1, the long-term upside-return profile of the stock market was substantial when the MSM was near post-war lows in 1982, the early 1990s, and in 2010; it was poor in the aftermath of the major MSM peaks of 1968 and 2000. This is illustrated in Chart 2, which compares the trailing five-year-average annualized S&P 500 total return with the MSM pushed forward (or leading) by five years. Although not a perfect relationship, the total return of the stock market in the next five years is closely and inversely related to the current level of the MSM.
Today, since MSM is near historic highs, return prospects for stocks in the next five years look poor. While the MSM suggests a tough environment ahead for stocks, it does not provide any timing insights. The stock market could erode steadily during the next five years, it could rise for a few more years and then collapse, or it could imminently collapse and then begin to perform well again. However, because confidence is high today and unemployment is low (i.e., the capacity of this recovery is near a peak), the risk-return profile of the stock market has worsened considerably, and investors should prepare for far less satisfying results in the next five years.
MSM And Commodity Prices?
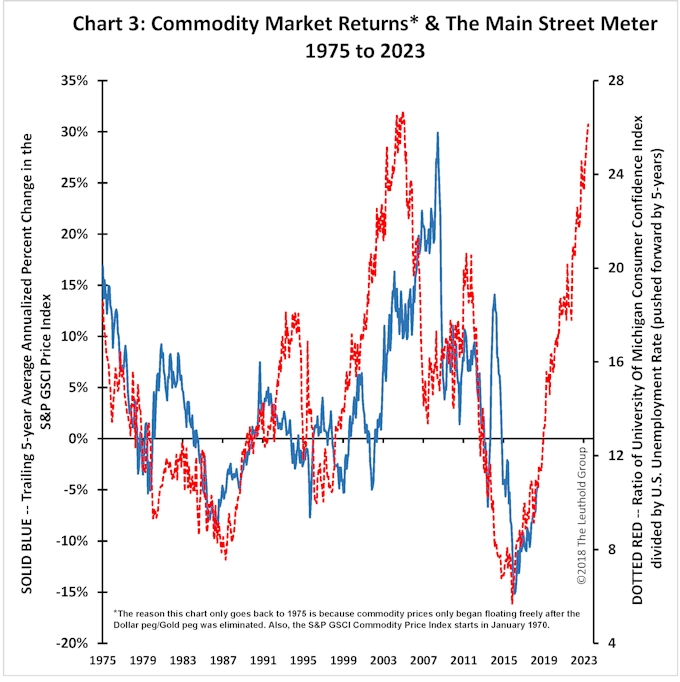
Perhaps investors should add some “real assets” to the investment portfolio. As shown in Chart 3, while the MSM suggests stocks may struggle in the next five years, commodities may have already turned higher and, unlike stocks, they have historically had a direct relationship with the MSM. The current environment of strong private-sector confidence and low unemployment has typically been a good backdrop for the future of commodity markets.
Moreover, if commodities are poised to do well, perhaps other real asset/inflation-oriented investments may also outpace expectations including real estate, inflation-linked bonds, and commodity-based sectors like energy, materials, and industrials.
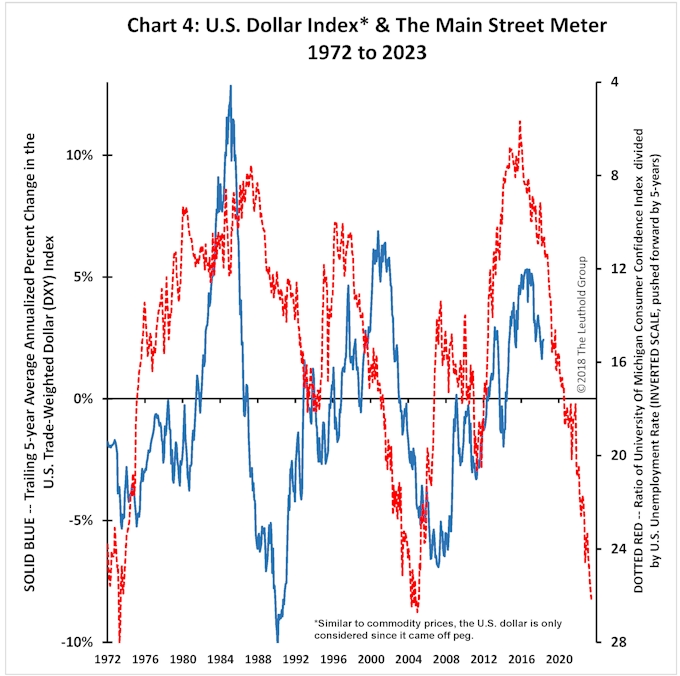
Finally, as shown in Chart 4, not surprisingly, since the MSM suggests a good environment for commodities, it is also suggesting the U.S. dollar is likely to continue weakening in the next several years. A weak trend in the U.S. dollar favors international investments, particularly the recently pummeled Emerging Markets.
MSM And A Few Stock Market Factors?
What is the longer-term outlook for factor tilts? Stay with Momentum? Value or Growth? Small or Large? Historically, the MSM has exhibited a leading relationship, with mixed success, to the relative performance of each of these factors.
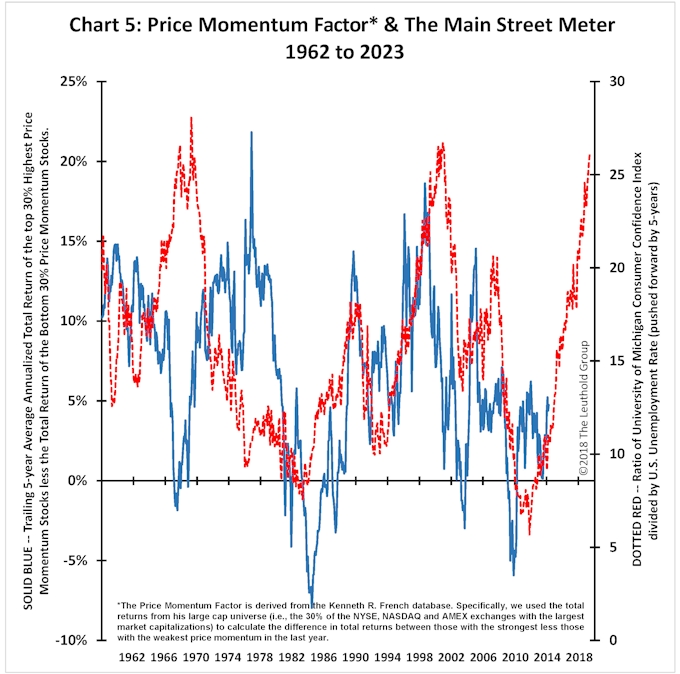
Chart 5 compares the trailing five-year Price Momentum excess factor returns with the MSM pushed forward (or leading) by five years. The MSM has done a fairly good job of forecasting the direction of Momentum returns in the ensuing five-year period with one notable exception. At the start of the 1970s, the MSM suggested that a significant decline in Momentum factor returns was forthcoming, but they actually accelerated during the next five years. Outside of that period, however, MSM has provided good leading indications of Momentum’s future performance. It has been particularly prescient since the start of the 1980s.
Currently, MSM suggests Momentum returns will strengthen in the next five years. Overall, Momentum has done best when MSM is high, and worse when it is low. When MSM is low, stocks generally have favorable outlooks as the overall stock market is typically headed for a good period. However, when MSM is high, as it is today, the stock market usually struggles, which perhaps highlights the unique value of those stocks that maintain positive price momentum. If the stock market is more challenging in the next five years, investors may be best served by tilting toward established winners?
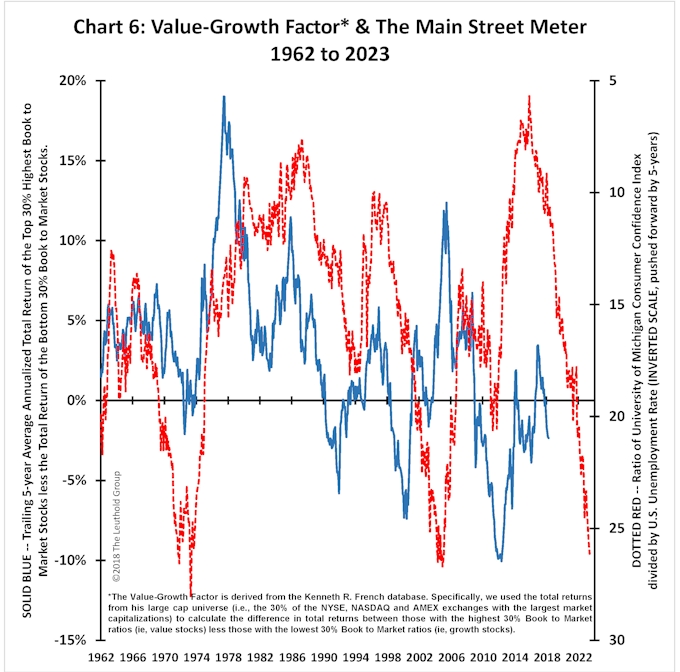
Chart 6 illustrates a leading relationship between MSM and future returns from the Value/Growth (VG) factor. Although the estimated magnitude of future five-year returns has not always been accurate, the forecasted direction of future VG factor returns has been respectable throughout the entire 56-year period. Typically, VG does best when the MSM is low and the economy has considerable room for improvement, while it often does poorly when the MSM gets strong. In the current recovery, the VG factor has not performed as well as was previously suggested by the MSM. Perhaps this reflects how long confidence remained weak during this recovery compared to historic norms.
While many expect Value to soon take the leadership mantle from Growth, MSM suggests that VG factor returns are likely to remain disappointing over the next several years.
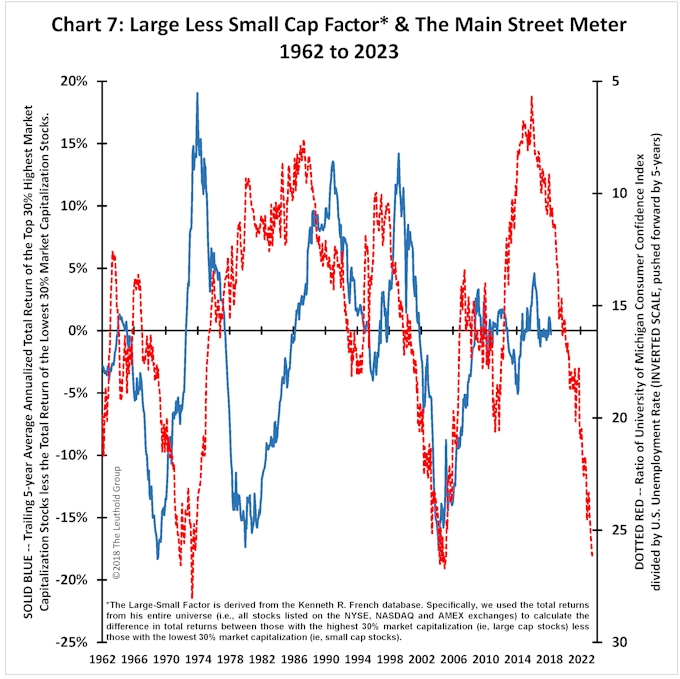
Finally, Chart 7 highlights the historical relationship between Large Cap less Small Cap returns (i.e., the LS factor) and MSM. Among the three factors we’ve examined, LS has the weakest relationship to MSM. Divergences were common throughout the 1970s. However, since about 1982, MSM has done a good job of predicting the direction of LS factor returns in the ensuing five years. Like the VG factor, however, the LS factor has not done nearly as well in this recovery as the MSM suggested. Traditionally, when MSM is low, large cap stocks have outperformed smaller company stocks. Today, by contrast, with the MSM near peak levels, perhaps the recent outperformance of small cap stocks will prove commonplace during the next five years.
Concluding Comments
This recovery began with the lowest MSM reading since 1960. It was initiated with considerable resource slack and extremely fearful private-sector players, which suggested there was record-setting room for improvement. And, the more than four-fold increase in the stock market since, is testament to its ultimate potential. Today, the environment is nearly transposed. The MSM is at its third highest level since 1960, fear has largely given way to economic confidence, and economic slack (at least according to the unemployment rate) is near a 50-year low.
While the change in the recovery’s character has near-term implications for the financial markets, it speaks volumes about the potential character of your investment portfolio during the coming five years. Conditions currently evident on Main suggest a tougher road for the financial markets in the next several years, but perhaps improvement in the real asset markets. It implies renewed weakness in the U.S. dollar, better equity returns abroad, and inflation-sensitive equity sector leadership. Finally, the MSM currently advises to stick with winners (Momentum), bias more toward small- and mid-cap weightings, and implies the return of Value leadership may remain elusive.
The MSM is not a useful short-term timing tool and offers little insight into how this year may yet play out. However, sometimes it is a good practice to step away from your inclination to figure out what is likely to happen next week, next month, or even next year, and consider how you are positioned to succeed during the next several years. Main Street has an opinion on that!

