
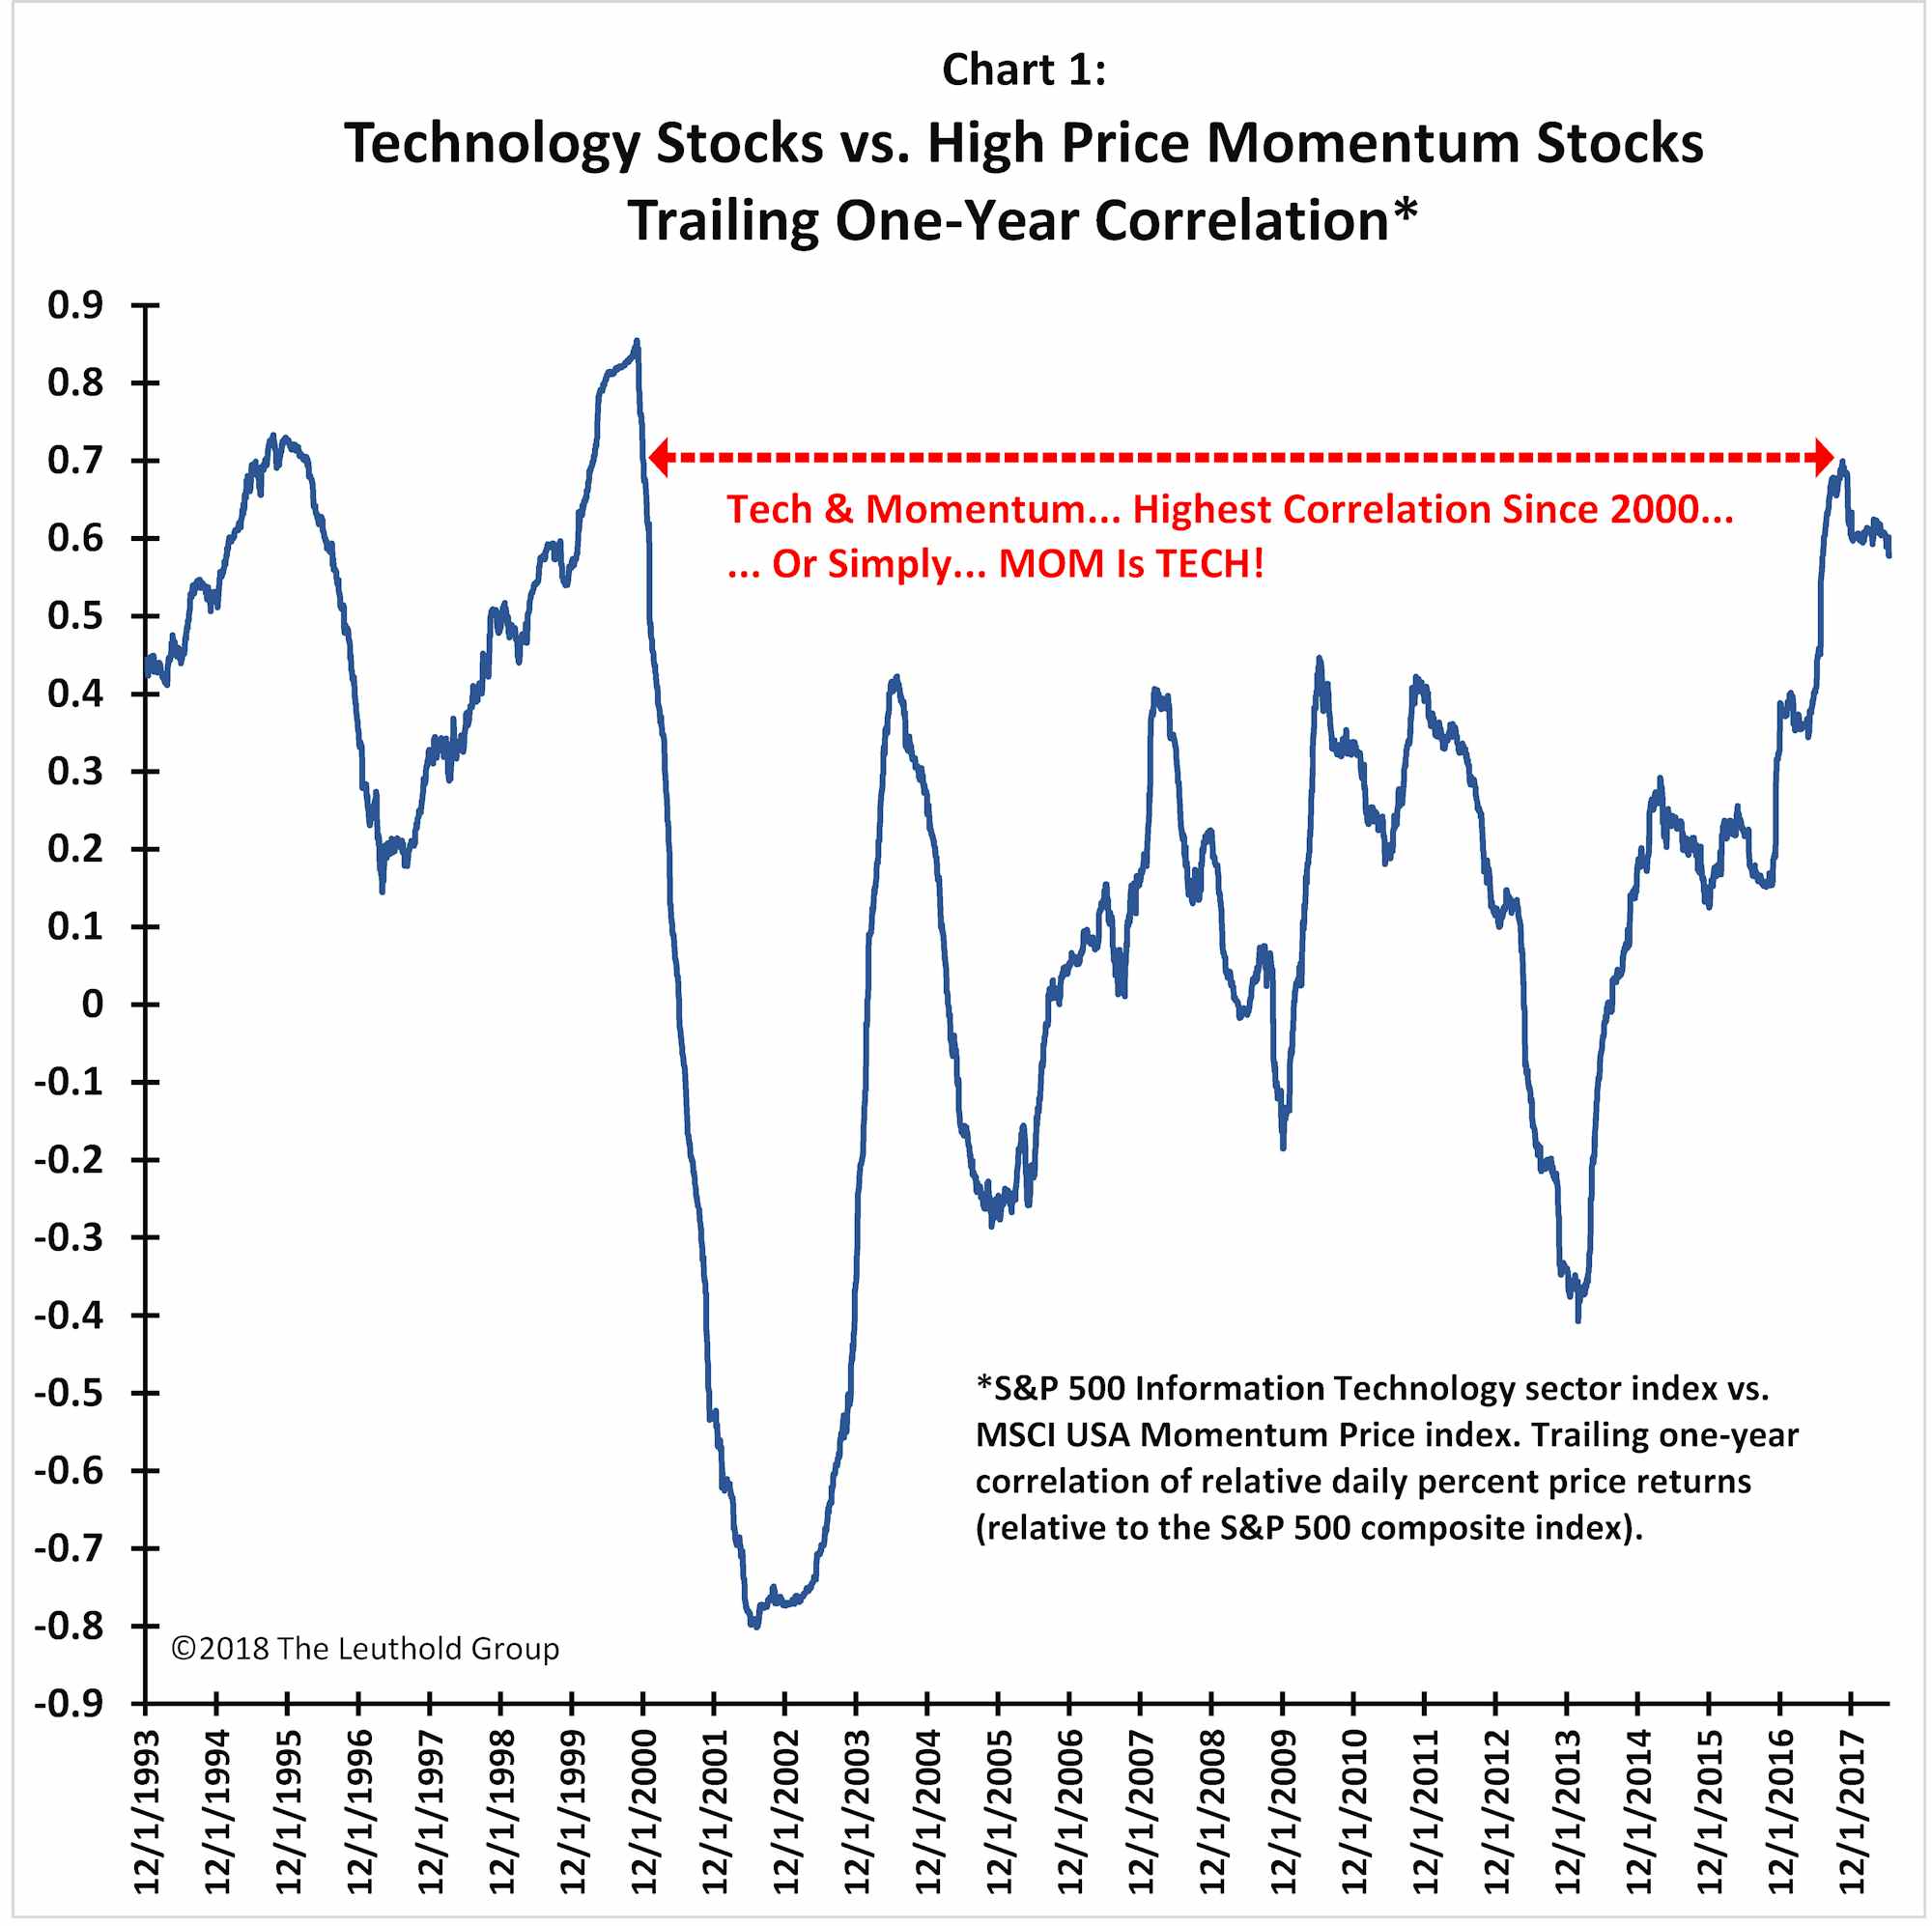
Another interesting echo, today, of the 1990s’ dot-com era, is how much the S&P 500 Technology sector has come to dominate price momentum (MOM) within the stock market. Like the late 1990s, stock market winners have become synonymous with technology.
Chart 1 illustrates the rolling one-year correlation between daily relative price performance of the S&P 500 Technology sector and the MSCI USA Momentum Price index. This correlation recently rose to its highest level since late 2000. Most recently, “winning with your equity portfolio”—or positive price momentum—has required a heavier emphasis on technology investments than at any time since the dot-com boom! After the 2000 stock market peak, this correlation never exceeded 0.45 until June 2017, and averaged only 0.14 between March 2009 and December 2016. Essentially, in this bull market, technology stocks were not highly correlated with the best performing stocks. However, during the last year, the correlation between the performance of technology and MOM surged to about 0.70. This compares to only a slightly higher peak of 0.85 in the dot-com era. Indeed, less than two years ago, in October 2016, this correlation was only 0.15 and today it remains near 0.60! Consequently, as it did in the late 1990s, tilting toward positive price momentum has become a metaphor for betting big on technology stocks.
The composition of today’s S&P 500 MOM portfolio highlights how concentrated “winning” has become. Chart 2 shows current sector weightings of the top quintile S&P 500 Momentum portfolio. Currently, technology stocks comprise about 26% of the S&P 500 market capitalization, but in the last year they accounted for almost 43% of the market capitalization of the top 100 performers (i.e., the winners’ portfolio). That is, the Technology sector is about two-thirds more strongly represented among the winners’ portfolio than it is in the overall S&P 500 index (i.e., 43% versus 26%). Moreover, this chart significantly understates just how concentrated investment success has become.
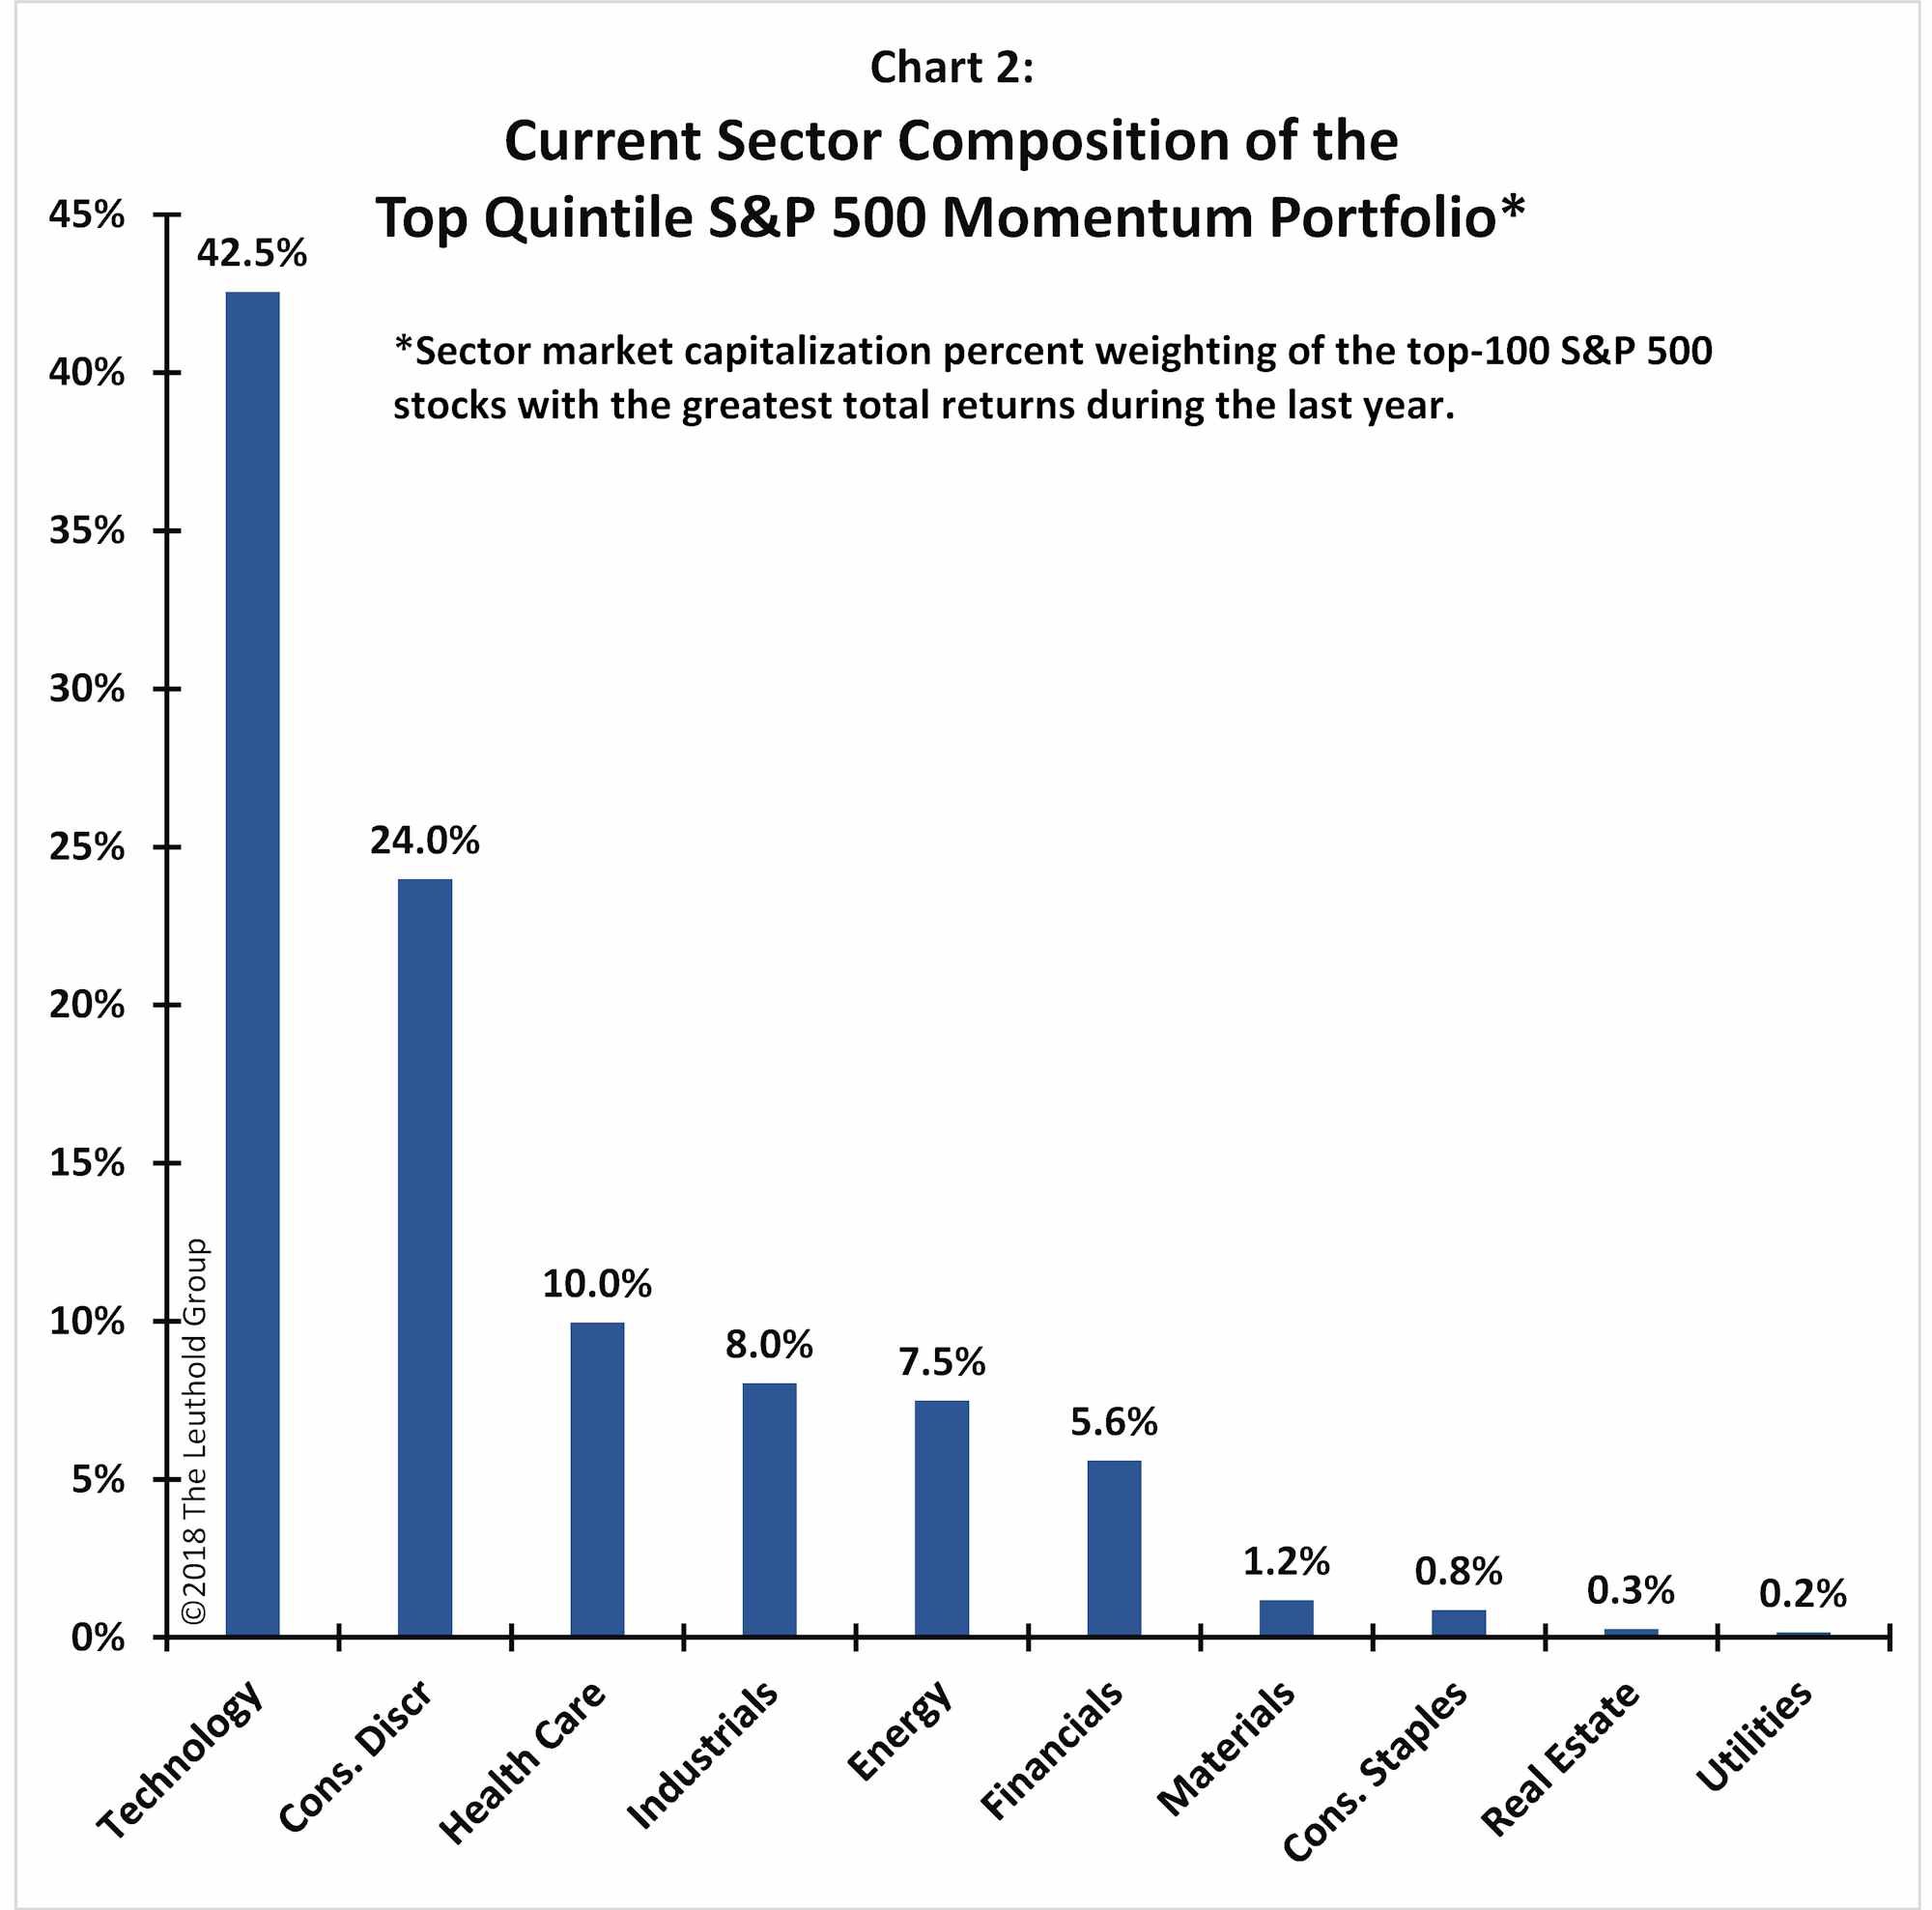
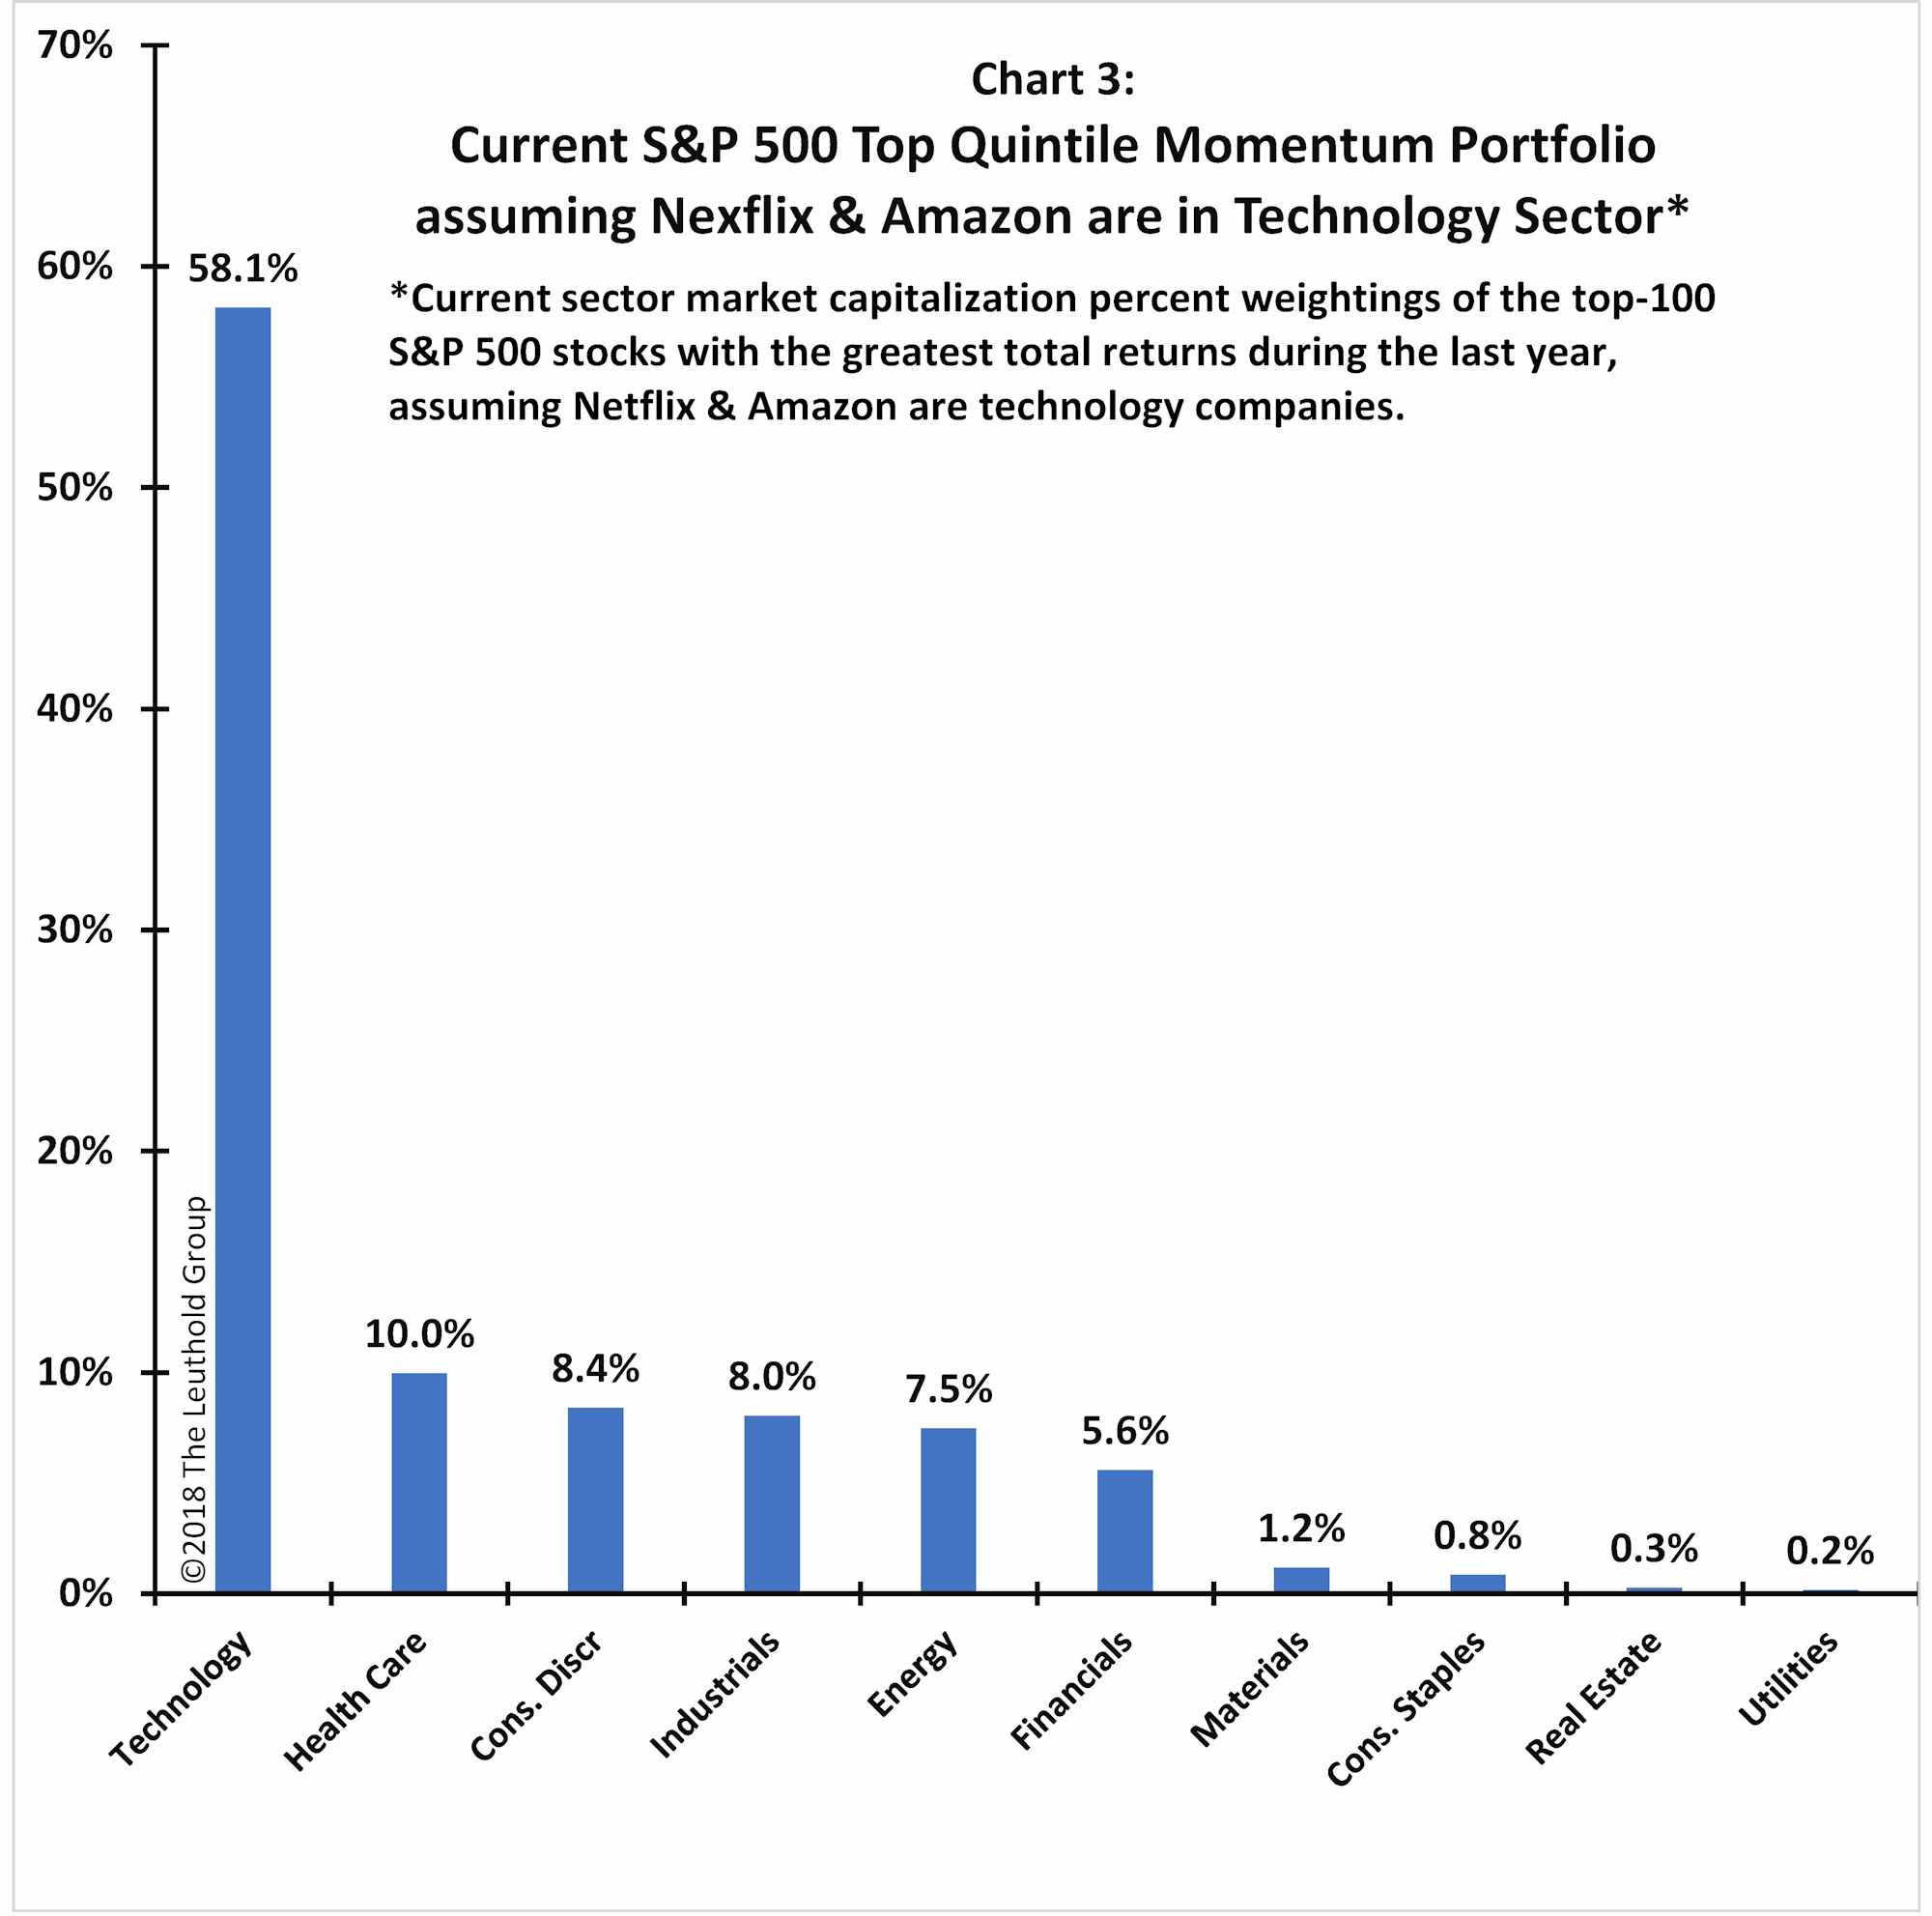
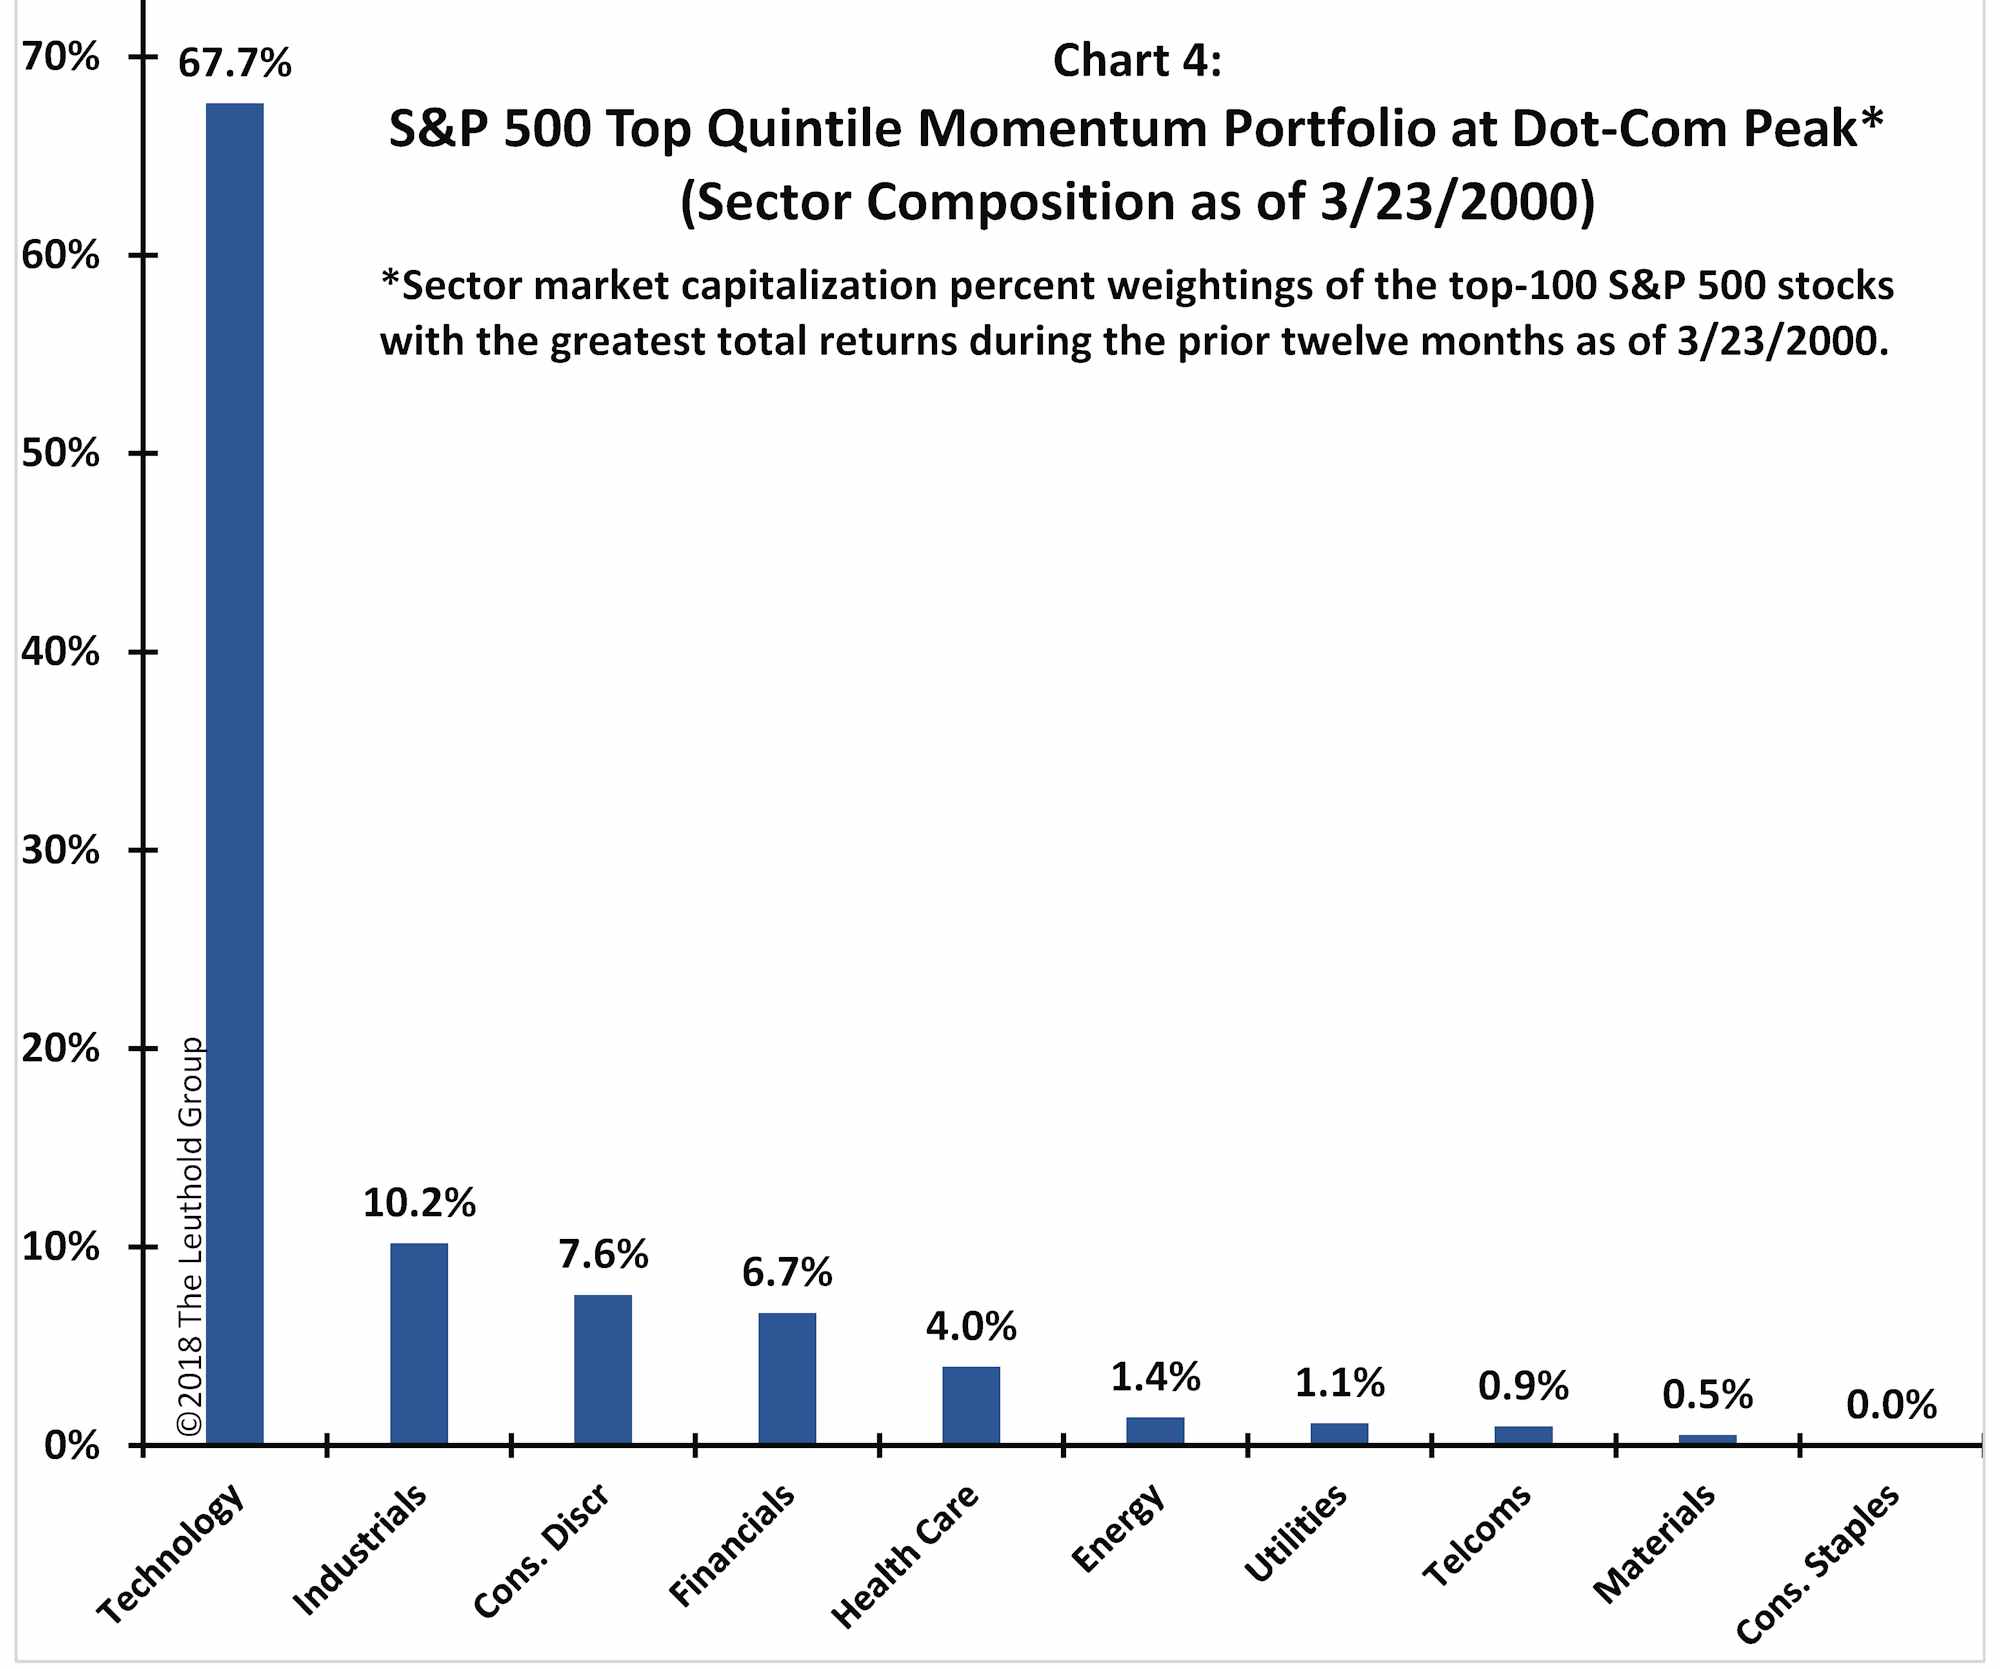
Chart 3 shows a strikingly narrower profile to the composition of the S&P 500 MOM portfolio if only two popular names (Netflix and Amazon) are moved from the Consumer Discretionary sector to the Technology sector. With this assumption, “technology” comprises almost 60% of the winners’ portfolio in the last year (or almost two times its weighting in the overall index)! For comparison, Chart 4 shows the composition of the top quintile momentum portfolio at the peak of the dot-com stock market—on March 23, 2000. At that point, technology stocks had comprised about 68% of the winners’ portfolio over the previous year (or also about two times the 35% weighting of technology stocks within the overall S&P 500 back then).
Summary
As in the late 1990s, beating the S&P 500 has increasingly become all about betting heavily on popular technology names. Over the last year, the degree to which technology stocks have come to dominate the “winners’ portfolio” illustrates the increasing narrowness of participation within the large cap S&P 500 universe and is reminiscent of the latter stages of the dot-com boom.
The valuations of S&P 500 technology stocks and the overall stock market are not as extremely priced today as they were at the top of the dot-com mania. However, momentum within the stock market has again become synonymous with owning popular technology names—suggesting the investment culture (and its potential reward, as well as its risk) rhymes a bit with the great 1990s’ bull run.